VMware Aria Operations for Applications (formerly known as Tanzu Observability by Wavefront) continuously adds new integrations to the existing set, and improves available integrations.
This document lists new and changed integrations for 2022. For earlier releases, see New and Changed Integrations in 2021 and New and Changed Integrations in 2019-2020.
- We have a separate document for Integrations Release Notes.
- We update our list of all integrations each time we add new integrations.
December 2022
We made improvements to the following integrations in December 2022:
-
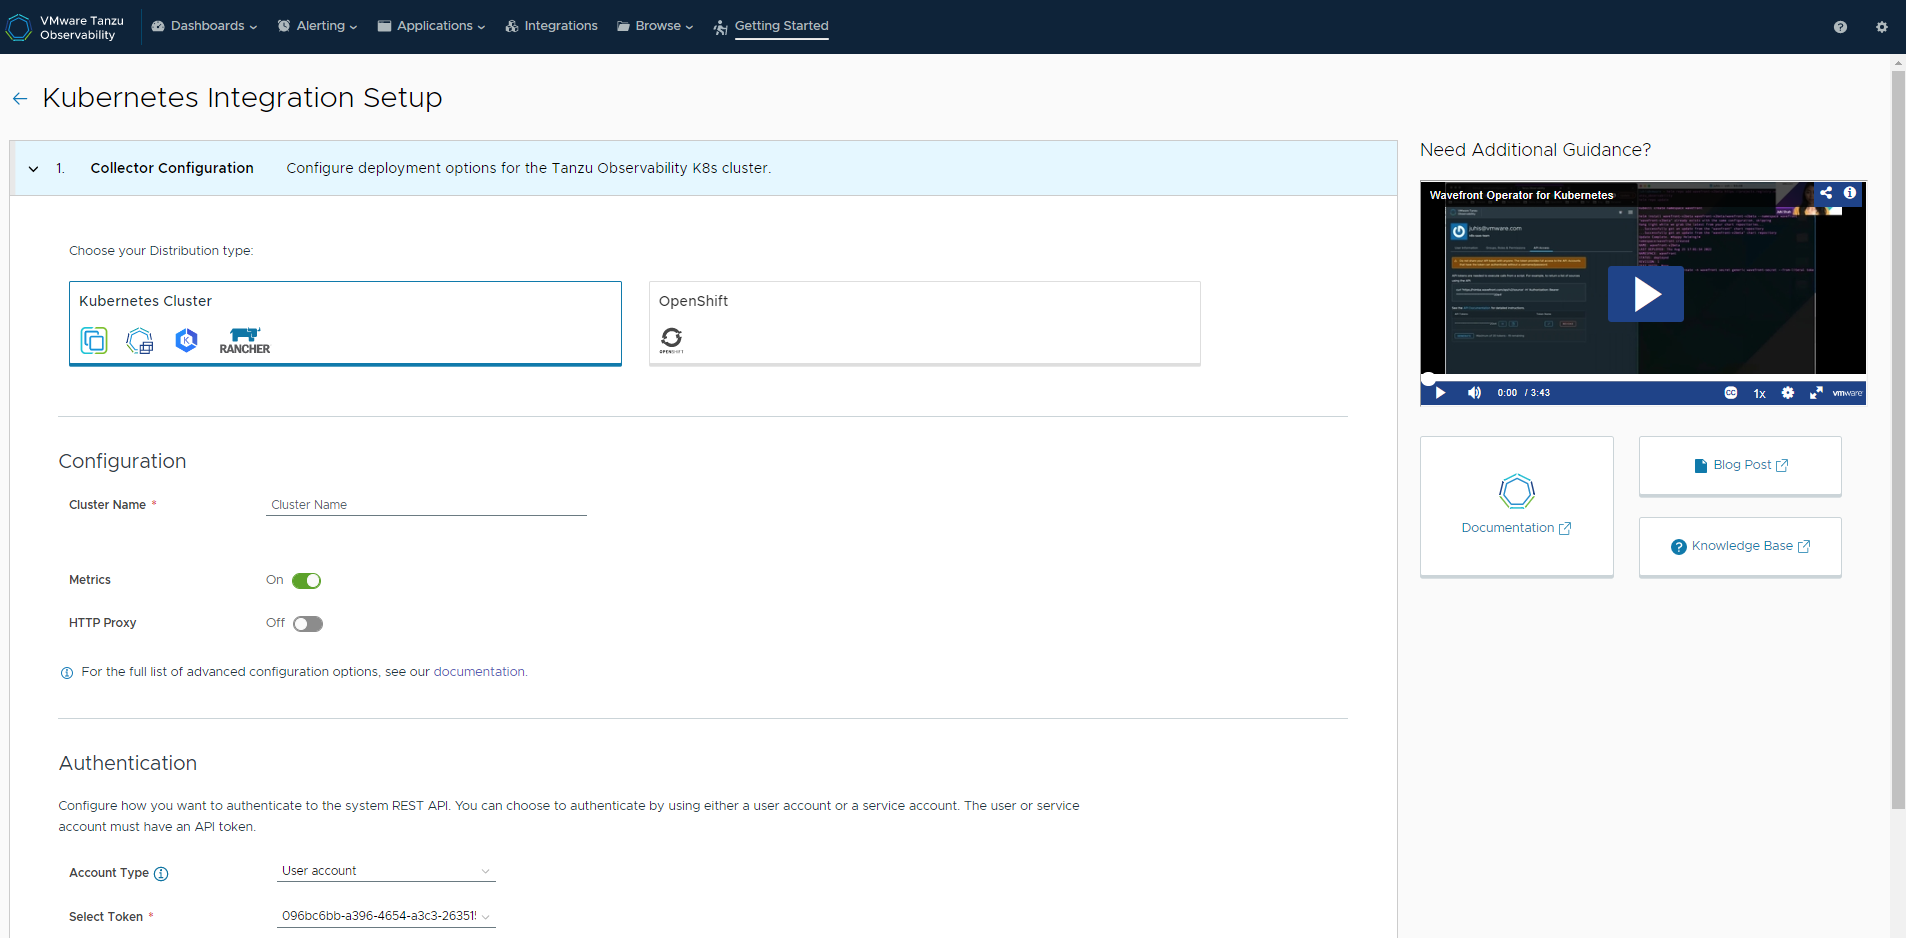
Kubernetes – New setup experience.
-
The new Kubernetes UI setup experience helps you streamline the deployment and initial configuration of the Kubernetes Observability Operator. You can enable key features, such as Logs (Beta), validate the integration, and get directed to key platform areas to start observing your Kubernetes environment. See Add a Kubernetes Integration for details.
-
We deprecate the Helm or manually-installed Kubernetes Metrics Collector and Wavefront proxy. Our new Kubernetes Operator replaces the Helm or manually installed Kubernetes Metrics Collector and Wavefront proxy for all Kubernetes Distributions except for OpenShift Container Platform.
If you currently use the Helm or manually-installed Kubernetes Metrics Collector and Wavefront proxy, the deprecation will NOT affect you and you won’t experience any disruptions. However, support (including bug fixes, security vulnerabilities, new functionality, etc.) will be discontinued on Feb 28, 2023, for the legacy collector and proxy installation methods.
Important: This change does not affect other integrations running on Kubernetes clusters. -
We have added a new troubleshooting page for Kubernetes.
-
Added a new Kubernetes Status dashboard. It allows you to monitor the Kubernetes integration health.
-
-
Tanzu Application Service:
-
We updated the Overview and Setup tabs to simplify the user experience.
-
Added
tas.capimetrics to the metrics documentation.
-
-
Snowflake:
- Updated the setup steps and the UI of the Snowflake integration with more details on the Snowflake account identifier that you have to enter. See Add a Snowflake Integration for details.
- Added support for ingesting Warehouse load history metrics real-time. These metrics earlier had a 3-hour delay.
-
NVIDIA:
- We added a new dashboard for GPU monitoring on the Kubernetes environments.
- We also updated the setup instructions on how to set up the integration and monitor NVIDIA on Kubernetes
- SNMP:
- Updated the queries in the Transmitted BPS and Received BPS charts.
- Apache Impala:
- Updated the setup instructions with Telegraf HTTP input plugin and starlark processor configuration to replace the Telegraf Exec input plugin.
-
Delta Counters - Related Changes:
- With the 2022-48.x release we stopped ingesting delta counter metrics. Therefore, we have removed the delta counters charts from the Amazon Web Services, Google Cloud Platform, and Azure integrations Metrics tab.
- Updated the Rate Limits Exceeded system integration alert queries to use the counter series
cs()function.
November 2022
We added the following integration in November 2022:
-
Tanzu Service Mesh:
Tanzu Service Mesh provides advanced, end-to-end connectivity, security, and insights for modern applications across application end-users, microservices, APIs, and data. It enables compliance with Service Level Objectives (SLOs) and data protection and privacy regulations.
We made improvements to the following integrations in November 2022:
- Terraform Provider:
- Improved the dashboard resource to set the default summarization to
MEAN. - Added examples on how to include dashboard sections from external files.
- Removed the Tesla Cloud integration resource.
- Improved the dashboard resource to set the default summarization to
- Microsoft Azure:
- Updated the Top 10 CPU Utilization chart in the Azure: Virtual Machine dashboard to use the average value instead of the total value.
- Updated the Overview tab to show information about the metric names. The default value for all azure metrics is the total value.
-
Tanzu Application Service – Made significant updates and improvements to the TAS integration system alerts. In addition, to improve customer experience, we have added new alerts and deleted the alerts that are no longer needed. For more information and troubleshooting steps, see Tanzu Application Service Alerts.
- VMware GemFire (previously, VMware Tanzu GemFire) – Replaced the dashboard for the GemFire for Kubernetes v1.0 operator with the dashboard for Gemfire for Kubernetes v2.0/v2.1 operator.
October 2022
Logs (Beta) Related Changes:
With the Initial Availability of our Logs (Beta) feature, we have made improvements to the following integrations:
- Linux Host – Now contains Linux Logs Setup (Beta) instructions. If Logs (Beta) is enabled for you, you can set up your Linux integration to send logs to our service. For details on the Logs (Beta) feature, see Get Started with Logs (Beta). For detailed steps on setting up the Linux Host integration, see Linux Logs Setup (Beta).
- Operations for Applications Usage – We added a Logs Stats section. It contains charts that track the amount of logs that are successfully delivered and successfully queried by our service. Also, the section shows charts that track the amount of logs that are received, queued, and blocked by the Wavefront proxy. Read more.
We made improvements and bug fixes to the following integrations in October 2022:
- Operations for Applications Usage:
- Made significant improvements to the Committed Rate vs Monthly Usage (PPS P95) for Billable and Usage (PPS) vs Remaining Balance (PPS P95) for Burndown dashboards. You can use the data displayed on the dashboard that suits your commit contract. For example, if you have a billable commit contract, only the Committed Rate vs Monthly Usage (PPS P95) for Billable dashboard will contain charts populated with data. The Usage (PPS) vs Remaining Balance (PPS P95) for Burndown dashboard will be empty.
- Made a minor fix to the Operations for Applications Service and Proxy Data dashboard.
- Terraform Provider:
- We added data source support for alerts, dashboards, events, derived metrics, maintenance windows, and external links.
- Added support for checking frequency of Terraform Operations for Applications Alert.
- User groups and roles can be now fetched by ID.
- We added a data source example to the sample Terraform Provider script.
- Tanzu Application Service:
- Made minor updates and fixes to the Tanzu Application Service dashboards and charts.
- Updated the Application CPU % chart in the Workload Monitoring dashboard.
- Made a fix to Step 2: Ops Manager: Install, Configure, and Deploy the Nozzle in the Tanzu Application Service documentation.
- Java – Fixed the links to the Jolokia 2 Agent documentation.
- Kubernetes – Added a new system alert to the integration. You can now get notified when the Kubernetes observability status becomes unhealthy.
- Google Cloud Platform – The Google Dataproc dashboard is now improved with information that you must create a derived metric if you see a delay in the loading of variables.
- Operations for Applications Tutorial – Made some minor fixes to the Introduction dashboard.
September 2022
We made improvements to the following integrations in September 2022:
- vSphere – Made fixes to the Cluster dashboard. Updated the cluster variable to all charts in the Virtual Machine Operations for a Data Center - 1 Hour section.
- Elasticsearch – Made a fix to the query of the chart that displays the number of nodes, and updated the descriptions of charts.
- Microsoft SQL Server – Added proxy preprocessor rules in the Microsoft SQL Server setup instructions to avoid database read/write metrics getting dropped because of an extra quote (“) in a few point-tag keys.
- Operations for Applications Usage – Made minor updates to the Overview tab of the integration. The link to the service internal metrics is corrected.
- Slack – Updated the setup instructions and added information on how to troubleshoot the Slack URL Unfurler.
- Cassandra – We updated the integration and now you can monitor Cassandra on Kubernetes.
- Tanzu Application Service – We added three new dashboards for monitoring TAS services:
- MySQL – Provides detailed metrics about TAS MySQL service instances.
- RabbitMQ – Provides detailed metrics about TAS RabbitMQ service instances.
- Redis – Provides detailed metrics about TAS Redis service instances.
- Terraform Provider:
- Upgraded the Terraform-plugin-sdk/v2 from version 2.6.1 to version 2.21.0 because of security vulnerability fix.
- Upgraded the
gopackage from version 1.16 to version 1.17 because of security vulnerability fix. - We now use an email address instead of an id for the
wavefront_useremail field.
- Tesla – We removed this integration and it is no longer available.
August 2022
We added the following integration in August 2022:
-
VMware Tanzu Greenplum:
VMware Tanzu Greenplum is a massively parallel processing (MPP) database server that supports next generation data warehousing and large-scale analytics processing. This integration installs and configures Telegraf to send system and query metrics into VMware Aria Operations for Applications.
We made improvements to the following integrations in August 2022:
- Amazon Web Services – We added a new Amazon FSx out-of-the-box integration dashboard, so now you can monitor the Amazon FSx service.
- Prometheus – Made improvements to the setup instructions.
- Google Cloud Platform – We added a new Google Dataproc out-of-the-box integration dashboard, so now you can monitor the Google Dataproc service.
- Cassandra – Made improvements to the Cassandra integration overview and setup instructions. Improved the Cassandra out-of-the-box integration dashboard.
- Spring Cloud Data Flow – Updated the latest document links on the Overview page.
- MySQL – We provided descriptions of approximately 1000 metrics. You can see the metrics and their descriptions on the Metrics tab of the MySQL integration.
- Java:
- Added a new Java Using Telegraf out-of-the-box dashboard that allows you to collect and monitor JVM metrics by using the Telegraf Jolokia2 Agent plugin.
- Added two system alerts that fire when the heap memory usage and the memory usage by the G1 old generation are too high.
July 2022
We made improvements to the following integrations in July 2022:
- Tanzu Application Service
- Support for use of v3 Wavefront Service Broker.
- New TAS: Nozzle Troubleshooting dashboard helps you investigate problems with the Nozzle.
- General security fixes.
- Minor updates to the TAS: Certification Expiration and TAS: Workload Monitoring dashboards.
- Google Cloud Platform – Added a Google Cloud Bigtable out-of-the-box dashboard which allows you to monitor the Google Cloud Bigtable service.
- Microsoft Azure – Made fixes to the Azure Cosmos DB dashboard to avoid showing the NO DATA message on single-stat charts.
- Fluentd – Improved the Fluentd dashboard and added two new sections to the dashboard: Buffer and Fluentd Statistics.
- Operations for Applications Usage – Made some fixes and standardized the Operations for Applications Service and Proxy Data dashboard.
- Kubernetes – Improved the Kubernetes Metrics Collector Troubleshooting dashboard to show correctly whether the desired number of Collector instances are ready.
June 2022
We made improvements to the following integrations in June 2022:
-
Tanzu Application Service:
- The Tanzu Application Service (Beta) integration is now renamed to Tanzu Application Service. It supports TAS v 2.11 and later.
- We added a new TAS: Nozzle Troubleshooting dashboard that allows you to monitor the metrics coming from the Wavefront Nozzle.
- The Tanzu Application Service integration that supports TAS v2.9 and v2.10 is now moved to the Archived section.
- Fixed issues with the TAS: RabbitMQ dashboard in the archived version of the integration.
- vSphere:
- Updated the vSphere setup documentation with best practices for metric collection and information about enabling custom attributes. See VMware vSphere Integration Details.
- Made many fixes to dashboards and charts. For example, now they list hosts which are not in clusters.
- Updated the names of a number of virtual machine charts in the vSphere Summary dashboard.
-
Consul – Updated the setup steps and the out-of-the-box dashboard to support both Cloud-Managed and Self-Managed Consul nodes.
- Google Cloud Platform – Added the list of metrics and metric descriptions for a number of services:
- Google Cloud Billing
- Google Cloud Spanner
- Google Cloud Logging
- Kubernetes Engine Metrics
- Google ML Engine
- Snowflake:
- To enhance authentication security, we updated the setup steps of the integration. Now, to register Snowflake, you have to provide a private key.
- We improved the setup instructions with information on how to generate the public and private keys and give Operations for Applications access to your Snowflake account.
- Improved the Snowflake Summary dashboard and included charts for warehouse load monitoring.
- Jenkins:
- You can now fetch metrics from Jenkins Prometheus with an authorized user instead of anonymous user.
- We improved the setup instructions with information on how to enable a Prometheus endpoint.
- Operations for Applications Usage – Updated the dashboard descriptions and made fixes to alerts.
May 2022
We made improvements to the following integrations in May 2022:
- Dynatrace:
- Improved the readability of the point tags and addressed an issue with duplicate metrics.
- Updated the setup instructions. When you generate the API token, you should select not only Read metrics (metrics.read), but also the Read entities (entities.read) token scope.
-
Fluentd – Updated the Fluentd integration and now you can monitor Fluentd on Kubernetes.
-
PostgreSQL – Updated the setup instructions and configuration with new extensions to monitor the database.
- TAS Beta:
- We made improvements to the TAS Beta dashboards.
- We have added a number of alerts. These alerts come from an older version of the integration and are not fully supported yet.
- Kubernetes:
- Added new Kubernetes control plane alerts: K8s control plane API Server SLO, K8s control plane CoreDNS SLO, and K8s control plane etcd SLO.
- The Kubernetes Control Plane dashboard now uses a new metrics prefix:
kubernetes.controlplane.
We updated the metrics descriptions for the following list of integrations:
- Apache HTTP
- Apache Tomcat
- Apache Solr
- Apache Spark
- Consul
- Istio
- Java
- MongoDB
- Spring Cloud Data Flow
- Windows Service
- Zabbix
- ZooKeeper
April 2022
We made improvements to the following integration in April 2022:
- Amazon Web Services – We updated the format of CloudWatch instance and volume allow lists to JSON format. When you register a new CloudWatch integration or edit an existing one, you can add instances and volumes to allow lists. The format of the tag lists should be in JSON format, for example
{"organization":"yourcompany"}.
March 2022
We added the following integration in March 2022:
-
VMware Blockchain
VMware Blockchain is an enterprise-grade blockchain platform that enables multi-party workflows. This integration is developed and created by the community and falls into to the Community Integrations section of the VMware Aria Operations for Applications Integrations page. We do not validate the community integrations and they are not fully supported by the VMware Aria Operations for Applications team.
We made improvements to the following integrations in March 2022:
- Kubernetes Integration
- Added a Kubernetes Control Plane dashboard to the Kubernetes integration. See the Release Notes on Github for details.
- You can enable the control plane metrics with helm, or using manual configuration. To see a full list of supported control plane metrics, visit our github repo.
- Operations for Applications Usage
- Added two new system dashboards to the integration: Committed rate vs Monthly Usage (PPS P95) Billable and Usage vs Remaining Balance (PPS P95) Burndown.
- Added three new system alerts: Percentage of Usage Scanned, Percentage of Usage Ingested, and Remaining Balance.
- Tanzu Application Service – Updates to the descriptions of the alerts and the setup instructions.
- Tanzu Application Service (Beta) – Updated the query metrics in the Ops Manager Health dashboard.
- VMware Tanzu GemFire:
- Updated the GemFire for VMs dashboard and now it is forward compatible with GemFire for VMs 1.15 and later.
- Added a list of alerts, such as Low Server Count, Low Locator Count, High CPU Utilization, and High Disk Utilization for all supported VMware Tanzu GemFire editions: VMware Tanzu GemFire for Kubernetes, VMware Tanzu GemFire (Standalone), and VMware Tanzu GemFire for VMs.
- Istio (Archived) – We removed this archived integration, and it is no longer available.
We made minor bug fixes and improvements to the following list of integrations:
- Amazon Web Services
- PingOne
- OpenTelemetry
February 2022
We added the following integrations in February 2022:
-
Tanzu Application Service (Beta)
This integration uses VMware Tanzu Observability by Wavefront Nozzle v4 and offers TAS data egress, dashboards, and alerting. This is a beta product and is not feature complete - more dashboards and alerting to come.
-
Dynatrace SaaS
This integration collects the metrics from a Dynatrace SaaS environment and sends them to VMware Aria Operations for Applications. The on-premises Dynatrace integration is moved to the Archived section.
Made improvements to the following integrations and dashboards in February 2022:
- Microsoft Azure:
- Updated the Overview tab with a new section named Metrics Information. You can now see a list with links to the Microsoft Azure documentation, which show you the metrics that we’ll be collecting once you set up the integration.
- Now includes an Alerts tab with predefined alerts.
- Ceph – Updated the Ceph integration and now you can monitor Ceph on Kubernetes.
- Amazon Web Services:
- Updated the Overview tab of the integration. You can now see a list with links to the Amazon Web Services documentation, which show you the metrics that we’ll be collected once you set up the integration.
- Now includes an Alerts tab with predefined alerts.
- Google Cloud Platform – Added a new out-of-the-box dashboard to monitor the Google Cloud Apigee service.
January 2022
We added the following integrations in January 2022:
-
Snowflake
You can use the Snowflake integration to monitor a Snowflake database and the ACCOUNT_USAGE schema.
-
Velero
You can monitor the Velero backup and restore solution. This integration is developed and created by the community and falls into to the Community Integrations section of the VMware Aria Operations for Applications Integrations page. We do not validate the community integrations and they are not fully supported by the VMware Aria Operations for Applications team.
Made improvements to the following integrations and dashboards in January 2022:
- OpenShift – Updated the Kubernetes OpenShift integration to use the newly certified helm chart.
- etcd – Updated the etcd integration with out-of-the-box dashboards to monitor etcd on Kubernetes.
- VMware Tanzu GemFire – Updated the VMware Tanzu GemFire integration with a new GemFire for VMs dashboard.
- Tanzu Application Service – Updated the queries of some of the Tanzu Application Service alerts:
- TAS Cloud Controller and Diego Not in Sync
- TAS Locks Held by Auctioneer
- TAS Locks Held by BBS