VMware Aria Operations for Applications (formerly known as Tanzu Observability by Wavefront) continuously adds new integrations to the existing set, and improves available integrations.
This document lists new and changed integrations for 2021. For earlier releases, see New and Changed Integrations in 2019-2020.
- We have a separate document for Integrations Release Notes.
- We update our list of all integrations each time we add new integrations.
December 2021
We added the following integration in December 2021:
-
vRealize Operations Integration v1
This initial version of the integration currently fetches only vCenter Server adapter resources, such as Cluster Compute Resource and Datastore. We will add more features to this integration in future releases. For information about setting up the integration, the current limitations and caveats, see vRealize Operations Integration Overview.
-
Photon OS Host
Now you can monitor hosts running Photon OS. Photon OS is an open-source minimalist Linux operating system from VMware that is optimized for cloud computing platforms, VMware vSphere deployments, and applications native to the cloud.
Made improvements to the following integrations and dashboards in December 2021:
- Kubernetes – Updated the Kubernetes Collector Troubleshooting dashboard to communicate the proxy version.
- Tanzu Application Service – Added a new out-of-the-box dashboard to monitor the doppler server.
- Microsoft Azure – Updated the setup steps for getting the application ID.
November 2021
We added the following integration in November 2021:
-
AVI Networks
Now, NSX Advance Load Balancer (AVI Networks) can be monitored by using out-of-the-box dashboards provided in the AVI Networks (NSX ALB) integration tile. This integration is developed and created by the community and falls into to the new Community Integrations section of the Integrations page. This is the first integration in this category. We do not validate the community integrations and they are not fully supported by the VMware Aria Operations for Applications team.
Made improvements to the following integrations and dashboards in November 2021:
- Data Platforms – Made query updates in health charts under the Mission Control section.
- Kubernetes:
- Updated the queries in the dashboard charts to show correct values in single stat charts.
- Updated the queries in the dashboards to fix NO DATA issues.
- Tanzu Application Service – Updated the Gorouter dashboard with new charts that show Gorouter metrics in histograms and monitor the router health.
- RabbitMQ – Updated the RabbitMQ integration and added an out-of-the-box dashboard and setup steps to monitor Rabbit MQ on Kubernetes.
- Redis – Updated the Redis integration and added an out-of-the-box dashboard and setup steps to monitor Redis on Kubernetes.
October 2021
Made improvements to the following integrations and dashboards in October 2021:
- Tanzu GemFire – Updated the Tanzu GemFire integration setup steps and added a new out-of-the-box dashboard to monitor Tanzu GemFire standalone deployment.
- Kubernetes – Made fixes to queries, so that they show correct values for the Kubernetes Metrics Collector and Wavefront proxy restarts.
- Azure Kubernetes – Made fixes to queries, so that they show correct values for running and pending pods.
- Envoy Proxy – Added an out-of-the-box dashboard and setup steps to monitor Envoy proxy on Kubernetes.
September 2021
Made improvements to the following integrations and dashboards in September 2021:
- Pivotal Cloud Foundry:
-
We now have Tanzu Application Service integration to support Tanzu Application Service 2.9 and later. We deprecated the Pivotal Cloud Foundry Integration as part of the renaming of Pivotal Cloud Foundry to Tanzu Application Service. The Pivotal Cloud Foundry integration which supports versions 2.2 to 2.8 is moved to the list of Archived integrations.
Note: If you already have installed the Pivotal Cloud Foundry (PCF) alerts, and want to migrate to the Tanzu Application Service integration, uninstall the PCF alerts, so that you don’t have duplicate versions of the same alerts. See installing and uninstalling integration alerts. Note that any changes to the PCF alerts that you have made will not be migrated and will be lost. You have to apply them manually after setting up the Tanzu Application Service integration.As a best practice, we recommend that you uninstall all PCF Dashboards before migrating to the Tanzu Application Service integration. See installing and uninstalling integration dashboards.
-
Optimized the filter queries in the out-of-the-box Tanzu Application Service (Pivotal Cloud Foundry) dashboards.
-
- AWS:
- Updated the query in the top 10 CPU charts of the AWS: ECS (Fargate) dashboard to show the correct values.
- Fixed bucket and region count mismatch issue in the AWS: S3 dashboard.
- Operations for Applications Tutorial – Added the following list of new chart types and examples to the Chart Types dashboard:
- Gauge
- Pie
- Node map
- Heat map
- Stacked column
- Kafka – Updated the integration to monitor Bitnami Kafka running on Kubernetes.
- Microsoft Azure – Added new out of the box dashboards:
- Azure: Cosmos DB dashboard for monitoring Azure Cosmos DB.
- Summary dashboard that gives a high-level view of the Azure environment.
- Istio – Updated the Istio setup instructions with mandatory metric configuration.
- vSphere – Updated the default configuration to add custom attributes to the metrics.
- Linux Host – Updated the summary section to use Gauge charts and fixed some errors in a couple of charts.
- Mac Host – Updated the summary section to use Gauge charts and fixed some errors in a couple of charts.
August 2021
Made improvements to the following integrations and dashboards in August 2021:
- Data Platforms:
- Added ESXi hosts charts to the Data Platform Blueprint1 - Kafka-Spark-Solr and Data Platform Blueprint2 - Kafka-Spark-Elasticsearch dashboards.
- Modified the Health calculation logic in the Mission Control Section in the Data Platform Blueprint1 - Kafka-Spark-Solr and Data Platform Blueprint2 - Kafka-Spark-Elasticsearch dashboards.
- AWS – Modified the CPU usage calculation logic in the CPU usage chart in the ECS (Fargate) Services dashboard.
- Java – Added out-of-the-box dashboard to monitor Java applications that are running in a Kubernetes cluster.
- Kubernetes (vSphere with Tanzu) – Added Setup steps for configuring Kubernetes collector to monitor vSphere with Tanzu.
-
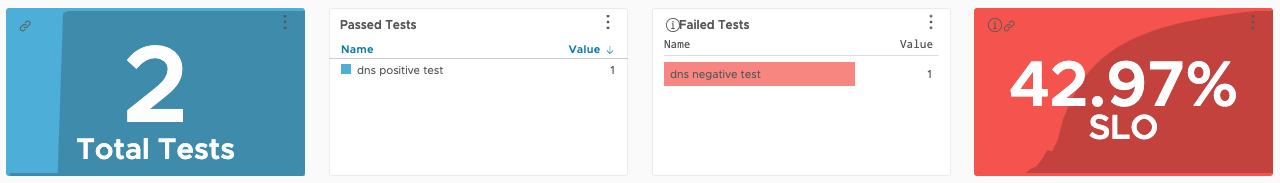
Catchpoint – Added an SLO chart to Catchpoint: API and Catchpoint: DNS dashboards.
July 2021
Made improvements to the following integrations and dashboards in July 2021:
- Project Pacific – Renamed the integration from Project Pacific Integration to vSphere with Tanzu Integration.
- VMware Cloud PKS – Removed the VMware Cloud PKS integration.
- OpenTelemetry – Updated the steps for configuring the application to send trace data to VMware Aria Operations for Applications using the trace exporter.
- Operations for Applications Usage – Added new charts to Proxies Overview section in the Operations for Applications Service and Proxy Data dashboard to show Spans Sampled By Policies.
- Azure AD – Added steps to configure Azure AD using Self-Service SAML.
- Data Platforms – Added a new dashboard Data Platform Blueprint2 - Kafka-Spark-Elasticsearch.
- Kubernetes:
- Added charts to Kubernetes Metrics Collector Troubleshooting (Kubernetes Metrics Collector) dashboard to monitor collector performance.
- Changed the metrics in the alert condition of the following out-of-the-box alerts:
- K8s node memory usage too high
- K8s pod memory usage too high
Tip: If you already cloned and customized one of these alerts, you have to clone and customize it again to use the improved alert condition.
June 2021
We added the following integrations:
- Data Platforms
- VMware tc Server 4.x
Made improvements to the following integrations and dashboards in June 2021:
-
Windows – Updated the out-of-the-box dashboard to use the correct metrics to calculate Physical Memory.
Note: In an existing Windows integration, you must update the
telegraf.conffile for the changes to take effect.-
Enable the memory plugin by adding it at the end of the
telegraf.conffile:[[inputs.mem]] name_prefix="win." -
Replace the line starting with Counters under
[[inputs.win_perf_counters.object]], with the following line:Counters = ["Available Bytes", "Cache Bytes", "Committed Bytes", "Commit Limit", "Cache Faults/sec", "Demand Zero Faults/sec", "Page Faults/sec", "Pages/sec", "Transition Faults/sec", "Pool Nonpaged Bytes", "Pool Paged Bytes", "Modified Page List Bytes", "Standby Cache Reserve Bytes", "Standby Cache Normal Priority Bytes", "Standby Cache Core Bytes"]
-
- Pivotal Cloud Foundry – Doppler health chart in the Pivotal Cloud Foundry Summary dashboard is updated to show correct health status.
- Amazon Web Services:
- AWS Kinesis Data stream dashboard has been updated to use correct metric to compute stream throughput.
- AWS Dynamo DB dashboard now supports monitoring of on-demand Dynamo DB.
- PagerDuty – Updated the setup instructions.
May 2021
Made improvements to the following integrations and dashboards in May 2021:
- AWS – Updated the AWS Summary dashboard to use Delta Counters.
- Linux – Updated the Linux integration to list all collected metrics.
- Operations for Applications Usage:
- The out of the box dashboards are updated to use new delta counters.
- The integration out of the box alerts are updated to use delta counters.
- Kubernetes:
- Fixed node and pod memory usage charts in the out of the box Kubernetes Dashboards.
- Fixed the Memory usage chart in the Troubleshooting dashboard.
- vSphere – Documentation fixes for vSphere integration.
- AWS ECS EC2 Integration – The integration is updated to use a Telegraf agent to gather stats on running containers in a Task.
- Consul – Made the new metric version 2 as the default metric format.
- MySQL – Made the new metric version 2 as the default metric format.
- Pivotal Cloud Foundry – Added new out of the box alerts based on the Tanzu Application Services KPIs.
April 2021
Made improvements to the following integrations and dashboards in April 2021:
- Zabbix – Updates to the integration setup instructions and to the out of the box dashboards.
- Prometheus – Updated the Prometheus integration to support metric version 2 as default metric format.
- Tracing dashboard – Fixed slow Apdex per operation query.
- Elasticsearch – Updates to the queries in the dashboards.
- Linux – Updates to the integration setup instructions.
- Pivotal Cloud Foundry:
- Fixed charts in the PCF: MySQL dashboard.
- Added the VMware Tanzu Application Services tile to the Pivotal Cloud Foundry integration.
- Istio – Deprecated the VMware Operations for Applications Istio adapter and added support to monitor Istio 1.8.
- Jaeger – Updates to the integration setup instructions to send data to the Wavefront proxy through gRPC.
- HipChat – Removed the HipChat integration.
- OpenTelemetry – Updates to the integration setup instructions.
March 2021
Made improvements to the following integrations in March 2021:
- Catchpoint:
- Labels in Catchpoint are available as point tags in VMware Aria Operations for Applications.
- Insight Settings in Catchpoint, such as tracepoints and indicators, are available as metrics in Operations for Applications.
- OpenTelemetry – Fixed broken links in the setup instructions
- Istio – Fixed broken links in the setup instructions
- Kubernetes:
- Updated the out of the box dashboards
- Now includes an Alerts tab with predefined alerts
- Spring Cloud Data Flow – Upgraded the integration to support Spring Cloud Data Flow 2.7.1 and Spring Cloud Skipper 2.6.1
- Tanzu Kubernetes Grid Integrated Edition – Fixes to the queries in alerts
- OneLogin – Updates to the integration setup instructions
- vSphere – Fixes to the out of the box dashboards
- RabbitMQ – Fixes to the out of the box dashboards
- Operations for Applications Usage – Added new alerts to the Operations for Applications usage integration
December 2020 - February 2021
We added the following integration in December 2020 - February 2021:
- VMware Tanzu™ GemFire®
Made improvements to the following integrations and dashboards in December 2020 - February 2021:
- New Tracing dashboards
- Amazon Web Services Gateway – New API gateway types
- Spring Cloud Data Flow – Spring Cloud Data Flow and Spring Cloud Skipper version upgrade
- Microsoft Azure Storage – New chart showing used capacity
- Operations for Applications Usage:
- Name changes to the dashboards
- Now includes an Alerts tab with predefined alerts
- Java
- Catchpoint
- AppDynamics – Updates to the setup UI
- Kubernetes – New out of the box dashboards
- OKTA – Updates to the setup UI
- Operations for Applications Tutorial
- Slack
- Amazon Web Services: Fargate dashboard
- Tanzu Kubernetes Grid Integrated Edition – Updated to support Tanzu Kubernetes Grid Integrated Edition 1.10
- Google Cloud Platform – New dashboard to support the new Google Cloud Platform Kubernetes metric namespace
gcp.kubernetes - Pivotal Cloud Foundry (TAS) – This integration uses the VMware Tanzu Observability by Wavefront Nozzle tile distributed by the Pivotal network. It has been updated to use Wavefront proxy 9.2 and stem cell 621.76.
All 2019 - 2021 Integrations
We have a separate page for New and Changed Integrations in 2019-2020.