You can view logs data on charts or you can use the logs table chart on a dashboard to preview the logs messages so you can troubleshoot faster.
Create a Chart for Logs Data
If you have the Logs and Dashboards permissions, in the Chart Builder you can create logs charts. A logs chart shows the number of logs by certain criteria. For example, see the logs chart in the Logs Browser.
|
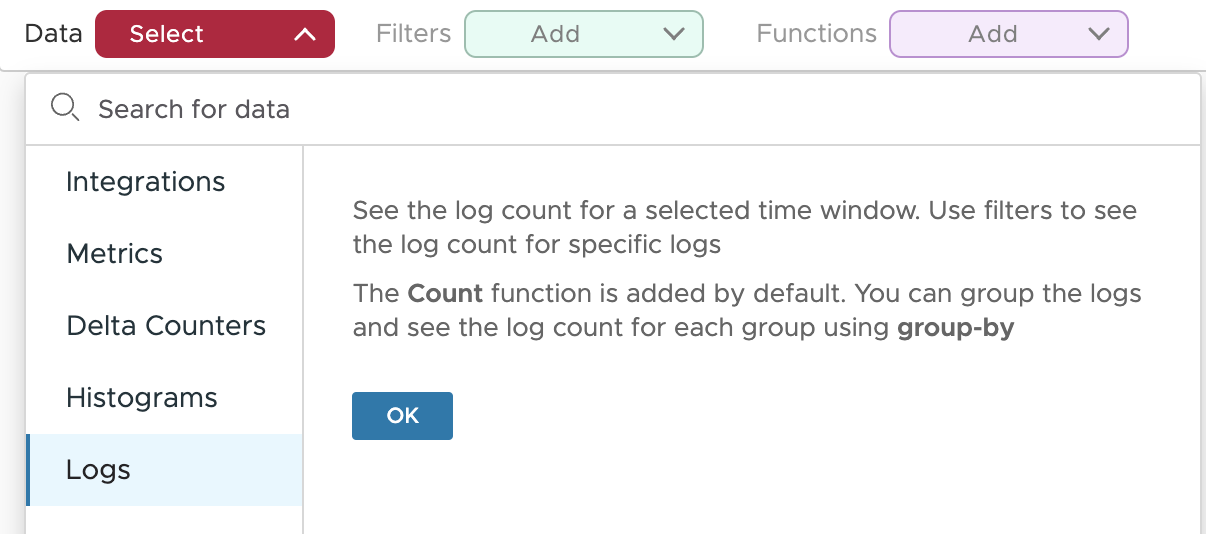
1. Select Dashboards > Create Chart on the toolbar. 2. From the Data drop-down menu, select Logs. |
|
|
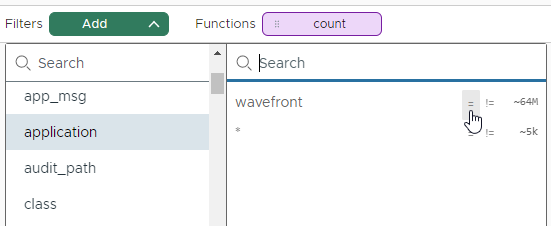
3. From the Filters drop-down menu, add one or more tag filters. You can add include and exclude tag filters. See Filter Types and Logical Operators for details. |
|
|
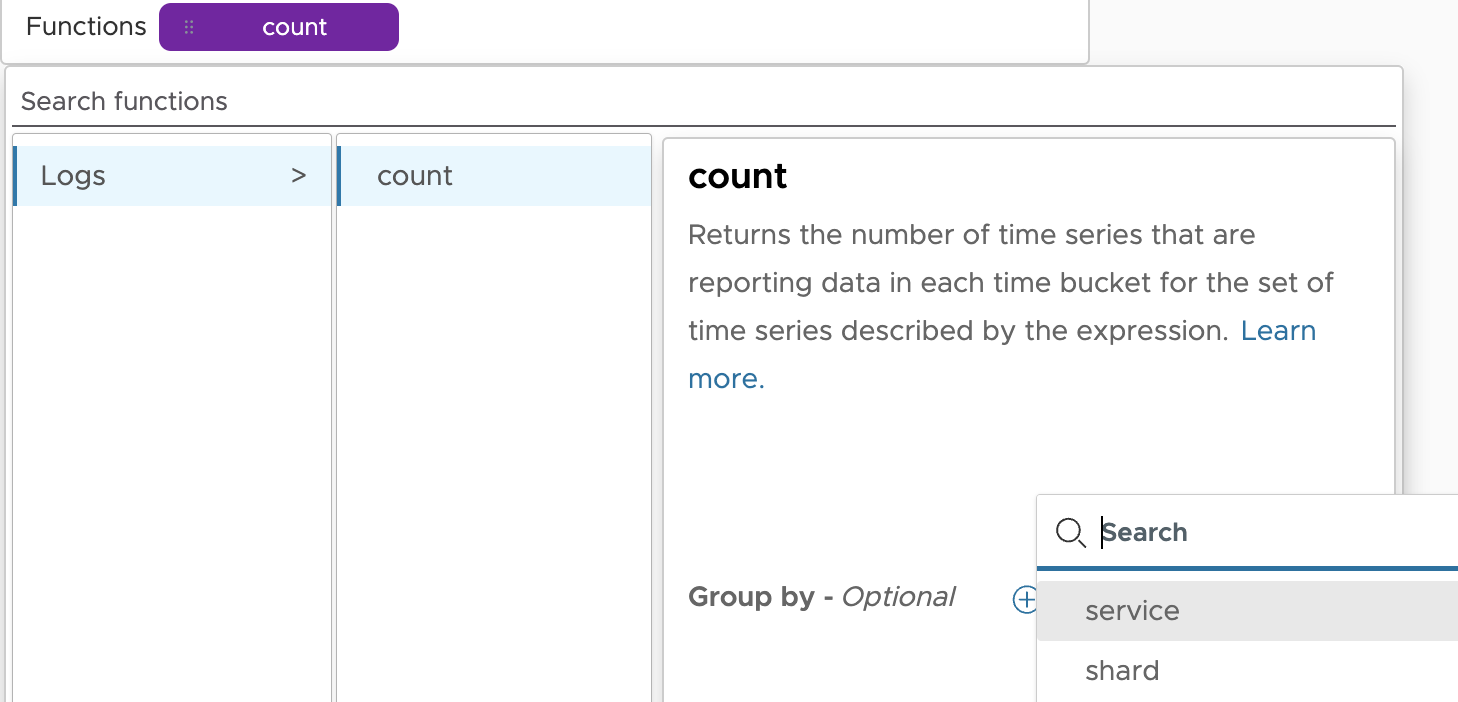
4. Optionally, next to the Functions drop-down menu, click Count, select one or more tags by which you want to group the number of logs, and click Apply. To add a note with code segment in it, follow the format given below: Note:
|
|
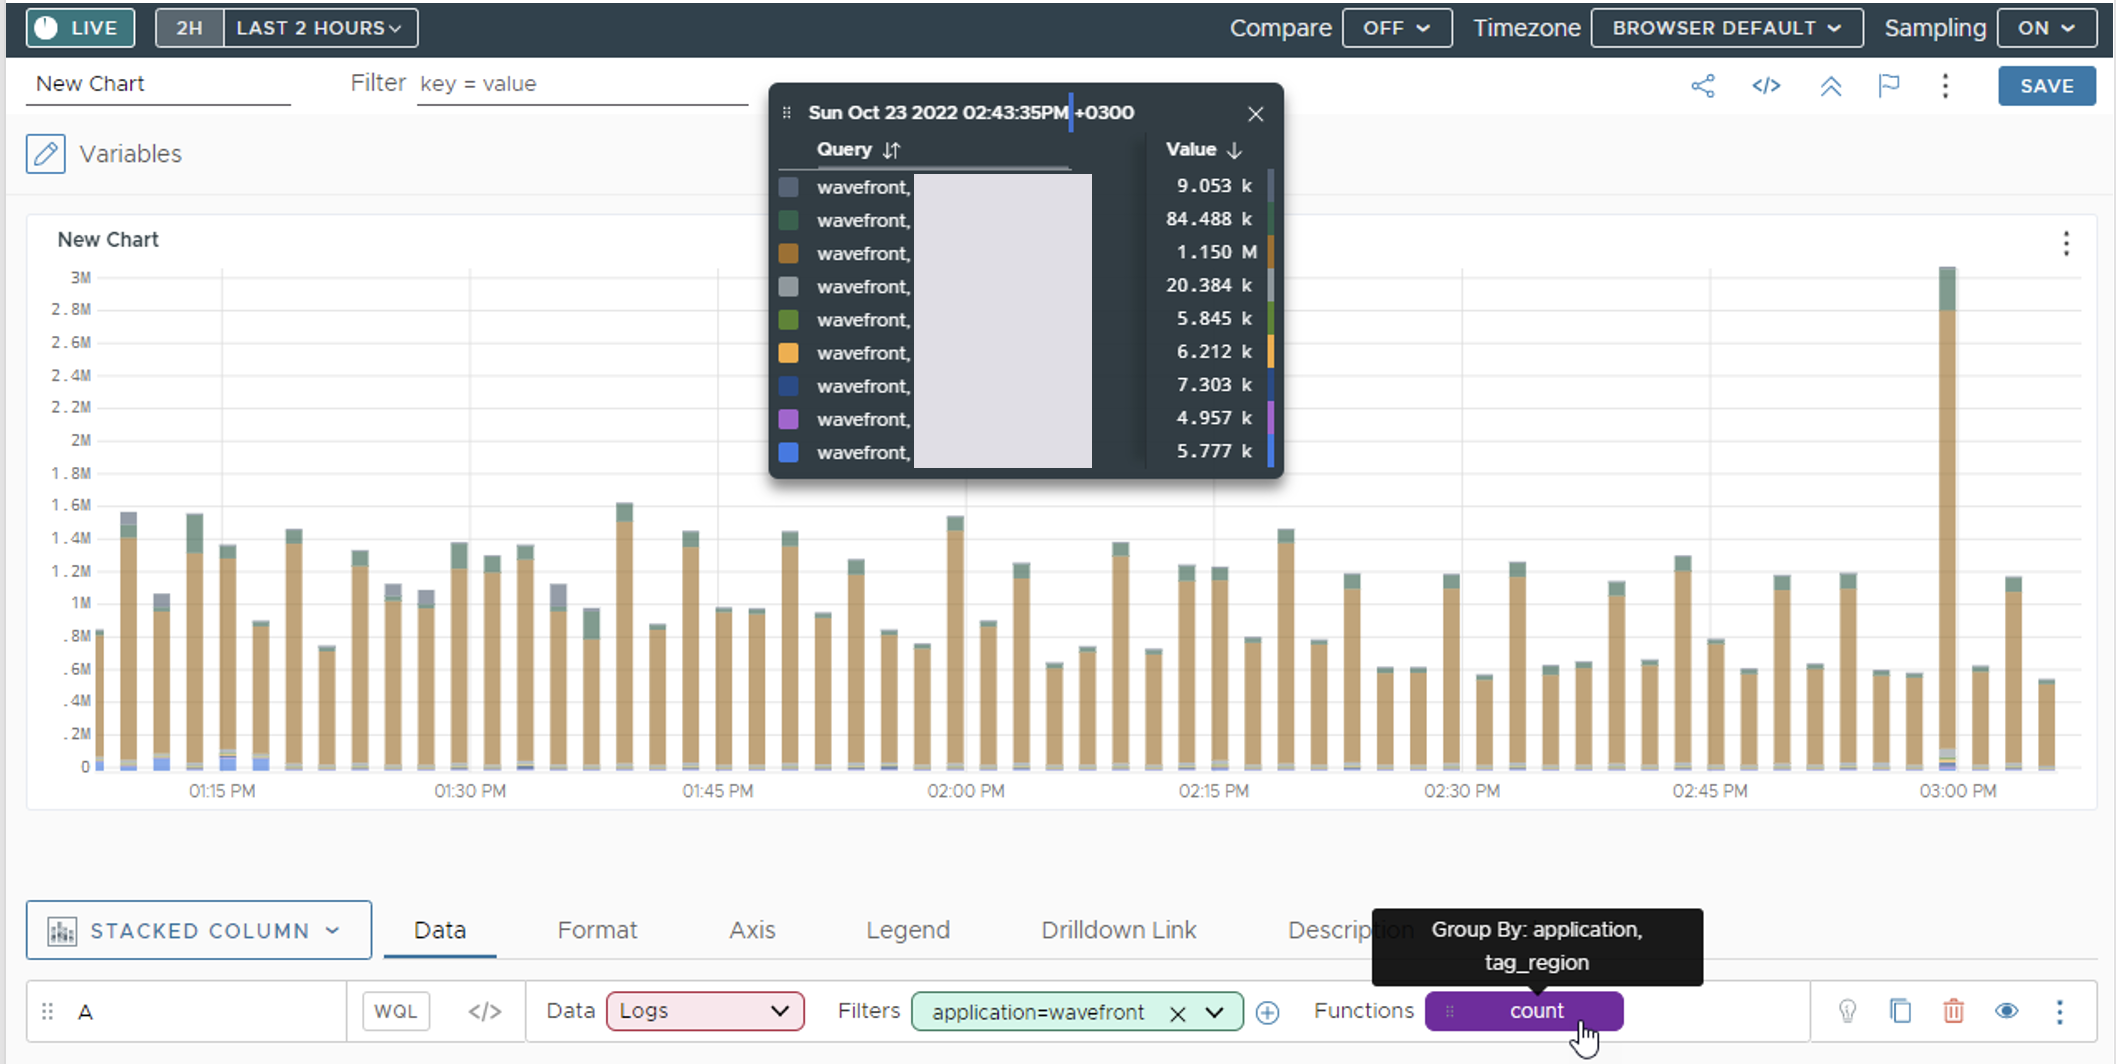
If you select the stacked-column chart, the resulting chart shows the number of logs matching the selected filters distributed over the selected time window. The logs are grouped by the values of the selected grouping tags. You can zoom in on smaller time windows. You can also use the logs table chart to see the logs on your chart.
Select the Logs Table Chart Type
After you select to see logs data on the chart you can view the logs data in a table using the logs-table chart type.
- Select the Logs Table chart type.
- Click the Format tab to customize the data displayed on the chart. For details see, Chart Reference.
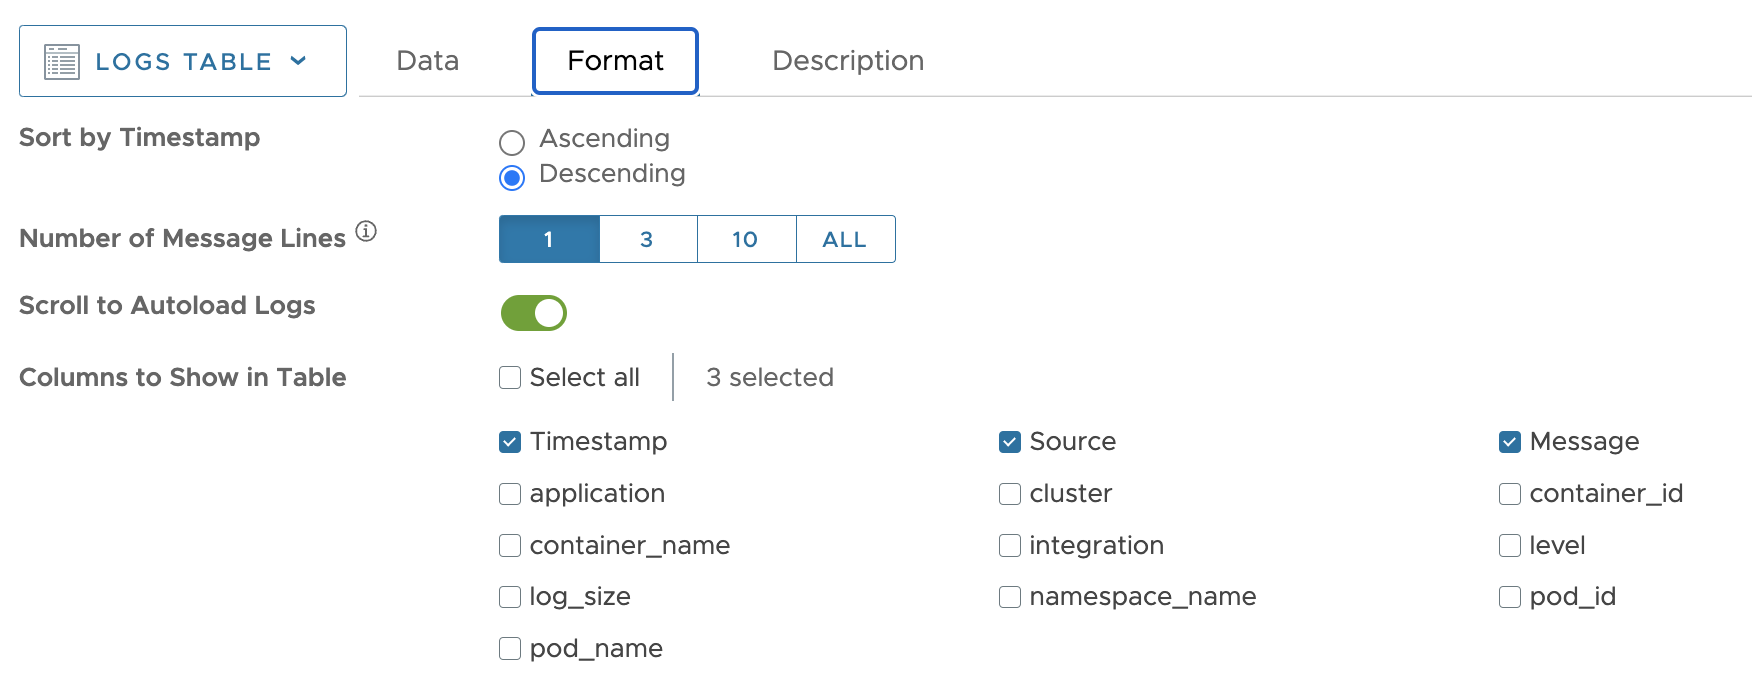
- Click the Description tab and add a description.
- On the top right, click Save.
- Specify the dashboard in which you want to insert the chart or create a new dashboard.
View Logs on the Chart
Once the chart is in a dashboard, you can:
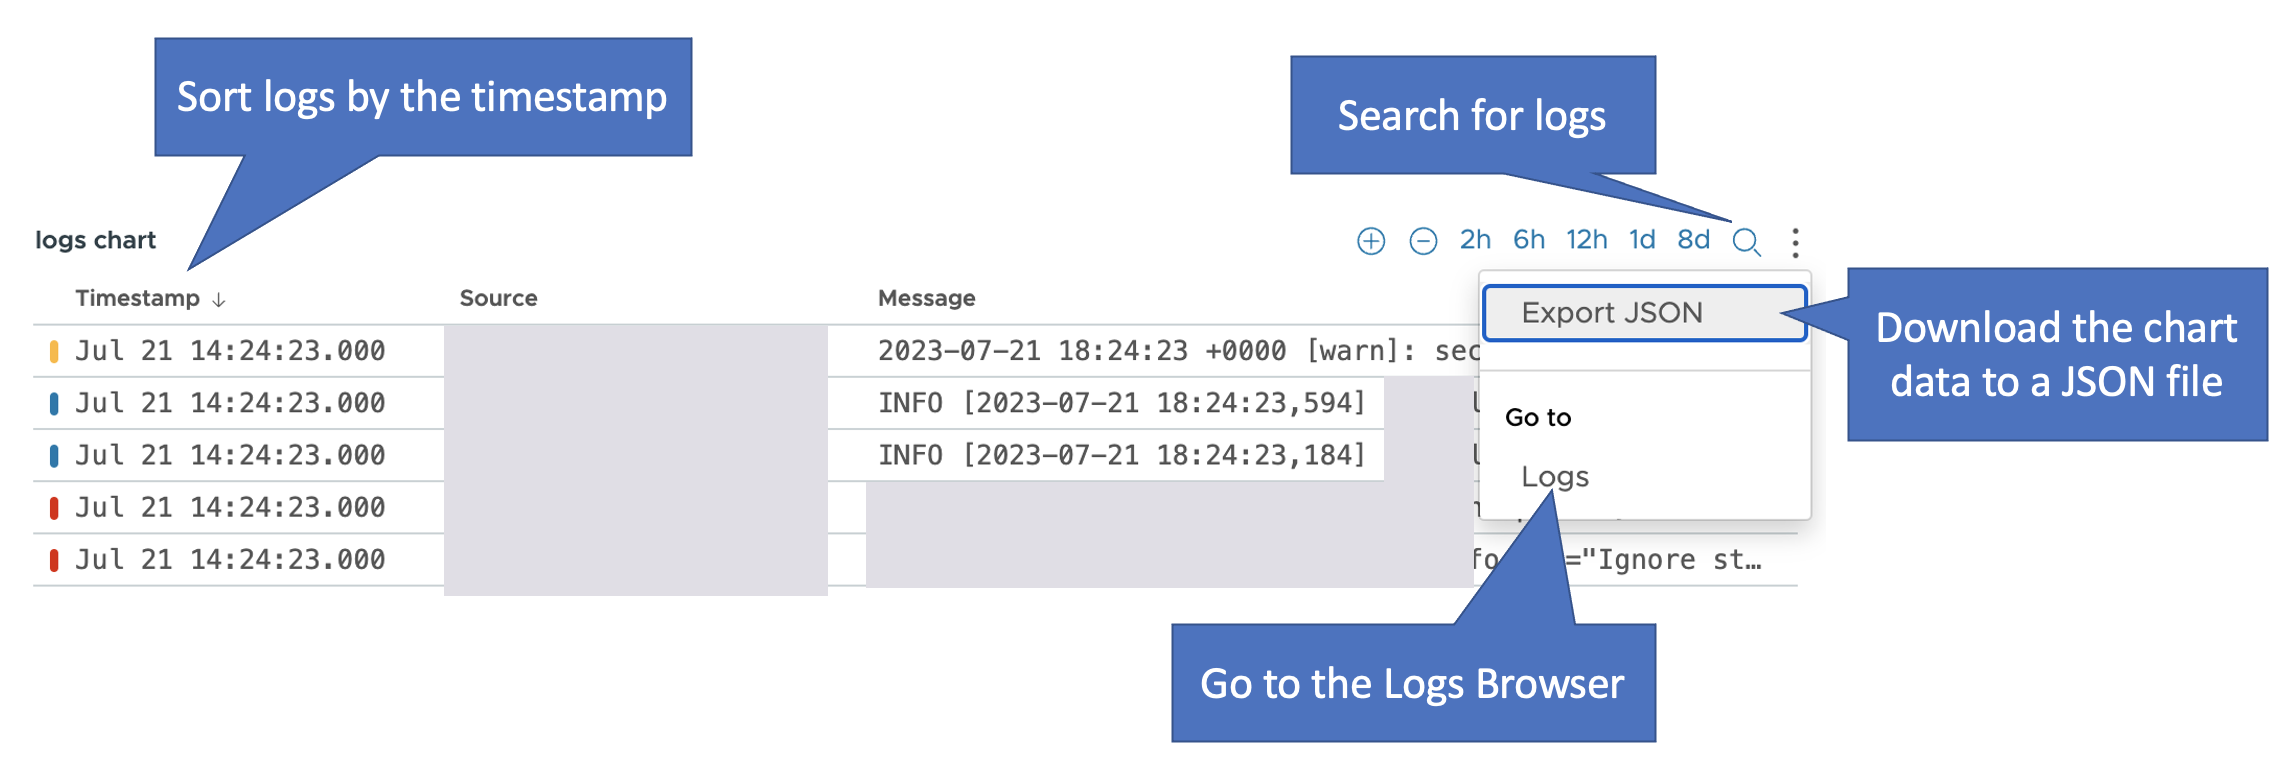
- Search for keywords or phrases. You only get results for the data in the logs chart table.
- If you want to drill into a specific log, right-click the row on the table, and click Logs. The tags on the log you selected carry over to the Logs Browser as filters, and you see all the logs with the same filters.
- If you want to see a specific log message while you troubleshoot and examine the other charts in the dashboard:
- Press Shift + p to pin the log message to the chart.
- To close the logs detail pop-up, click the x in the top right corner.
- If you want to copy a log message, press Shift + c.