This page provides an overview of what you can do with the Linux Host integration. The documentation pages only for a limited number of integrations contain the setup steps and instructions. If you do not see the setup steps here, navigate to the Operations for Applications GUI. The detailed instructions for setting up and configuring all integrations, including the Linux Host integration are on the Setup tab of the integration.
- Log in to your Operations for Applications instance.
- Click Integrations on the toolbar, search for and click the Linux Host tile.
- Click the Setup tab and you will see the most recent and up-to-date instructions.
Linux Host Integration
Monitoring Linux hosts is easy with Tanzu Observability. This integration installs and configures Telegraf to send host metrics into Tanzu Observability. Telegraf is a light-weight server process capable of collecting, processing, aggregating, and sending metrics to a Wavefront proxy.
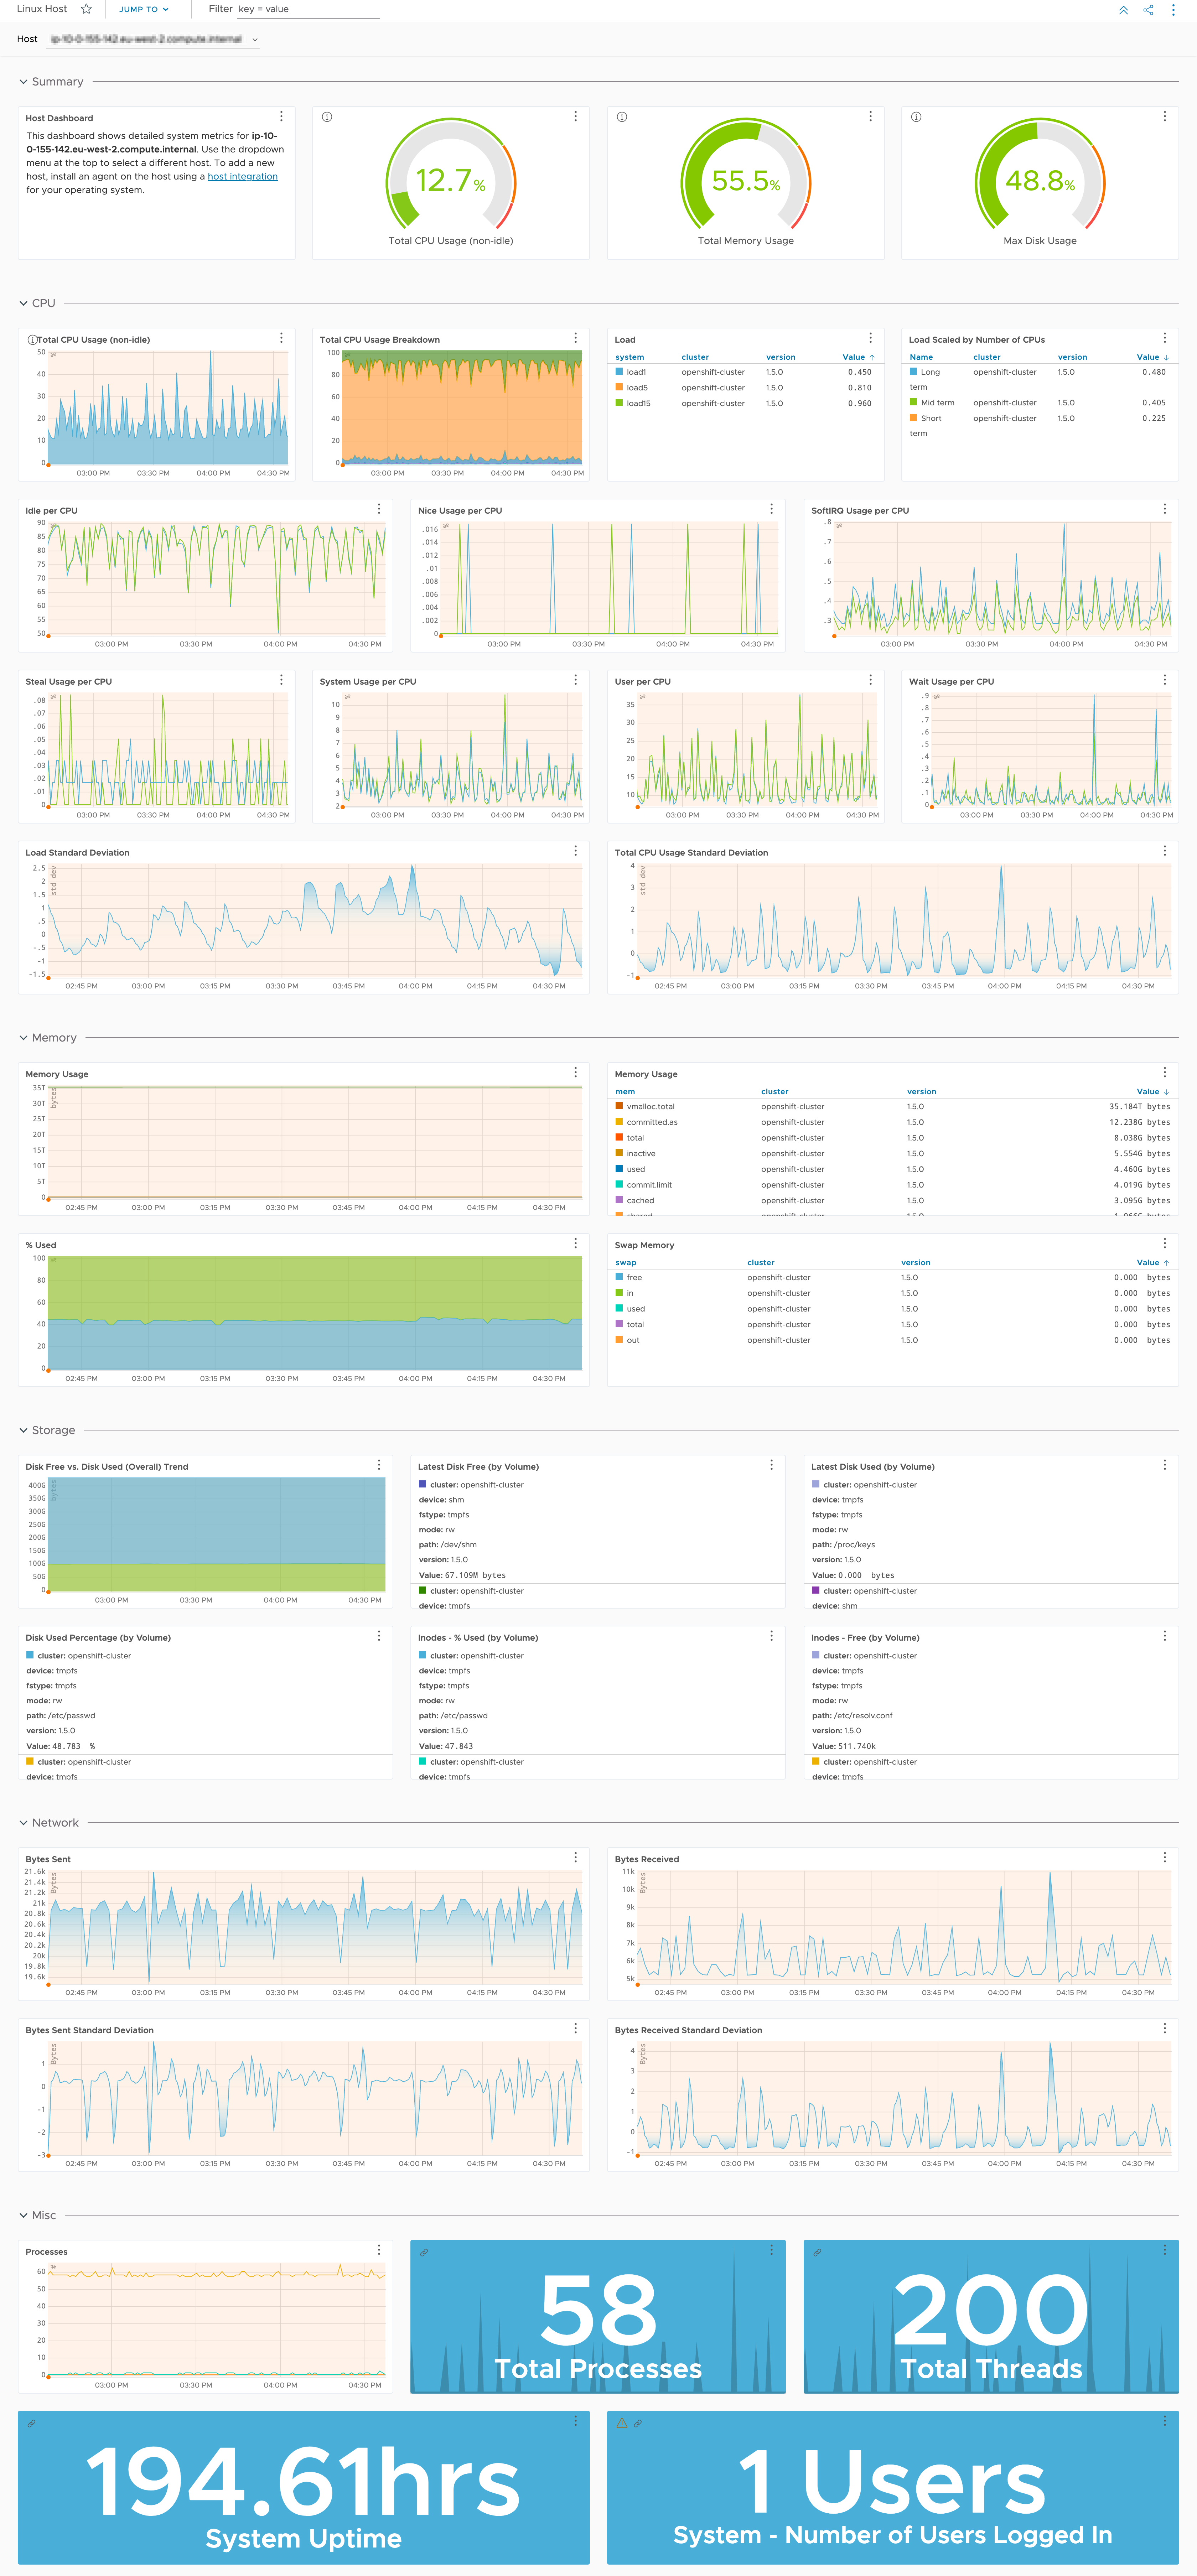
In addition to setting up the metrics flow, this integration also installs a dashboard. Here’s the CPU section of a dashboard displaying Linux host metrics.
Linux Logs Setup
This integration uses Fluentd input plugins and offers several setup options. For Fluentd installation prerequisites, see the Fluentd Requirements.
- Use a proxy already running in your environment (preferred) or install a new proxy.
- Install the Wavefront proxy and Fluentd agent on the same host or on separate hosts.
Install the Wavefront Proxy
The Wavefront proxy is required to send logs from your systems into Tanzu Observability. If you have not already done so, install a Wavefront proxy (version 11.4 or later).
Install Fluentd
Install Fluentd to send logs data to Wavefront proxy.
-
See the prerequisites for installing Fluentd.
-
To install the stable distribution package of Fluentd, called
td-agent, use one the following cURL commands, depending on the Linux distribution that you use:# Ubuntu 20.04 Focal curl -L https://toolbelt.treasuredata.com/sh/install-ubuntu-focal-td-agent4.sh | sh # Debian Bullseye curl -L https://toolbelt.treasuredata.com//sh/install-debian-bullseye-td-agent4.sh | sh # Redhat/CentOS 7/8 curl -L https://toolbelt.treasuredata.com/sh/install-redhat-td-agent4.sh | shThe command automatically installs Fluentd and starts the daemon. To make sure that everything is running as expected, run the following command:
systemctl status td-agent.serviceIf you use a different Linux distribution, see the Fluentd installation documentation.
Configure Fluentd
Use the following example to configure the input and output sources for Fluentd logs. In this example, we’ll use syslog logs as the input.
- Open the Fluentd configuration file:
sudo vi /etc/td-agent/td-agent.conf - Define syslog as the input source for Fluentd:
# You can add additional files as sources. <source> @type tail path /var/log/syslog pos_file /var/log/td-agent/syslog.pos pos_file_compaction_interval 72h read_from_head true format none path_key tailed_path tag linux.syslog </source> - Define the Wavefront proxy as a “match” (the Fluentd term for an output destination):
# ------- Tagging and sending the tags to the Wavefront proxy. -------
# You can add additional fields.
<filter linux.**>
  @type record_transformer
  enable_ruby
  <record>
    source ${hostname}
    timestamp ${time.to_datetime().strftime('%Q')}
    log_integration_source "linux"
    service ${tag_suffix[-1]}
    application wavefront
  </record>
</filter>

<match linux.**>
   @type copy
   <store>
    @type http
    endpoint http://WAVEFRONT_PROXY_ADDRESS:2878/logs/json_array?f=logs_json_arr
    open_timeout 2
    json_array true
    <buffer>
      flush_interval 10s
    </buffer>
  </store>
</match>
Replace WAVEFRONT_PROXY_ADDRESS with the address of your Wavefront proxy.
Restart Fluentd
Restart the Fluentd service:
systemctl restart td-agent.service
View the Linux Logs
In the Logs Browser you can see your Linux logs. You can also search and filter the logs, and troubleshoot your issues.