These release notes give an overview of the changes for the 2022-41.x to 2022-49.x releases of the VMware Aria Operations for Applications (previously known as Tanzu Observability by Wavefront) service.
2022-49.x Release Notes
- Charts Improvement: You can now create an event from within a new chart and then save the chart to a dashboard.
- Logs (Beta) Improvements:
- We’ve just released Wavefront proxy 12.1, which supports ingesting logs as line-delimited JSON objects (JSON lines), and you can now configure Fluent Bit as a log shipper.
- You can now customize the logs details table to change the number of lines per row.
2022-48.x Release Notes
-
New Kubernetes Integration Setup UI Experience: With this release, we introduce new setup UI for the Kubernetes integration. See the Integration Release Notes for details.
-
Usage Portal Improvements: We made the following improvements to the ingestion policies and overall usage monitoring:
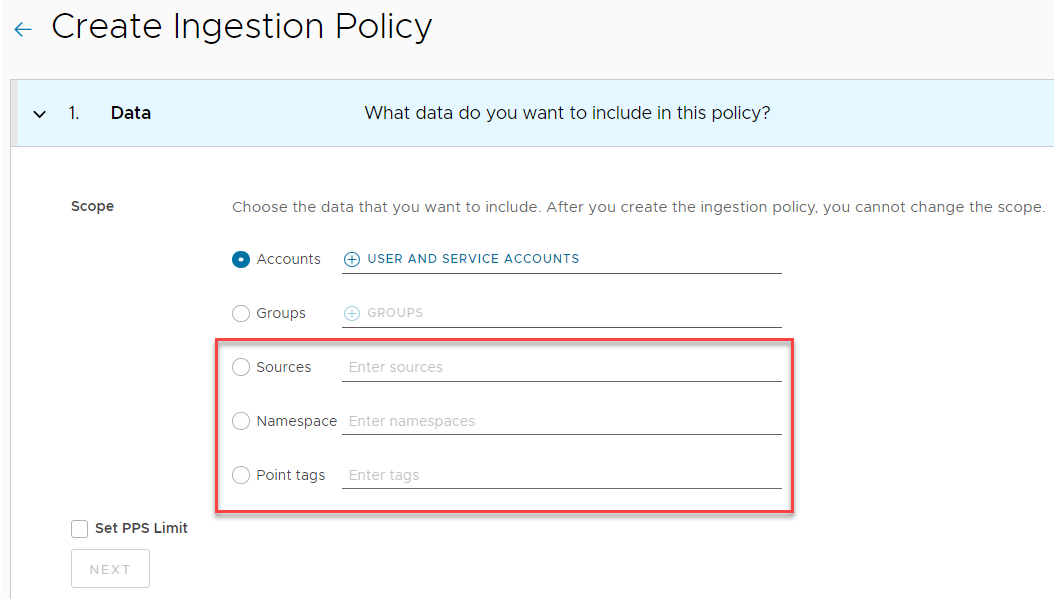
Important: Currently, the Usage Portal improvements are not available for all customers.New Ingestion Policy Scopes: We added sources, namespaces, and point tags as scope options for ingestion policies. As a Super Admin user, when you create an ingestion policy, you can now select the scope from one of these options:
- Accounts
- Groups
- Sources
- Namespaces
- Point tags
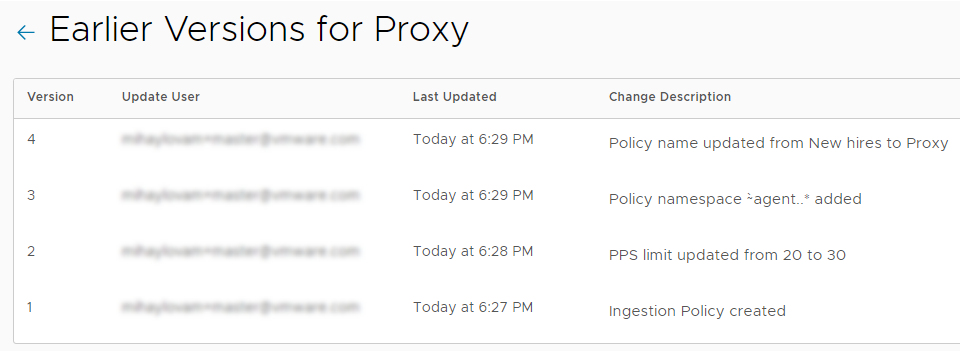
New Ingestion Policy Version History: As a Super Admin user, when you edit an ingestion policy, you now create a version of that policy. As a Super Admin user, to see the changes that have been made to an ingestion policy over time:
- From the gear icon on the toolbar, select Usage and Subscriptions and click the Ingestion Policies tab.
- Click the ellipsis icon next to the policy and select Versions.
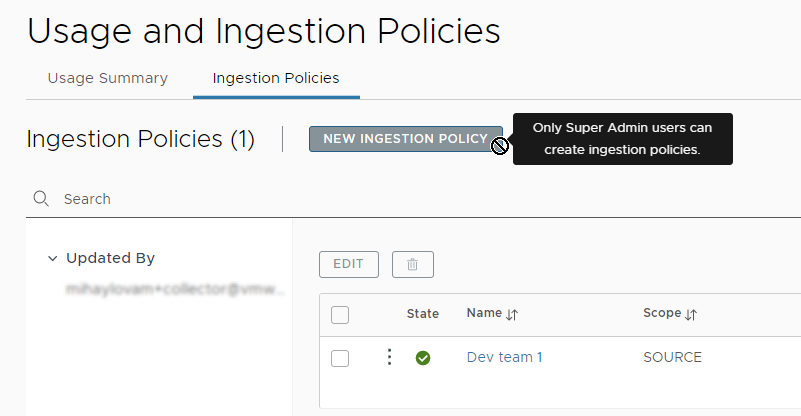
New View Permissions Model: All users now have read-only access to the Usage Summary dashboard and the ingestion policies. If you are not a Super Admin user:
- From the gear icon on the toolbar, select Usage Portal.
- On the Usage Summary tab, you can examine the dashboard for the overall PPS usage over time.
- On the Ingestion Policies tab, click the name of a policy and examine the policy PPS usage since the policy was created.
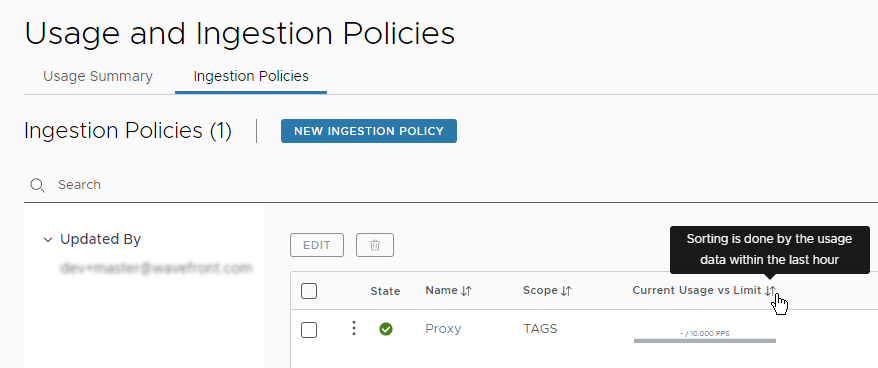
Sorting Ingestion Policies by Current Usage: You can now sort the ingestion policies by PPS usage within the last 1 hour.
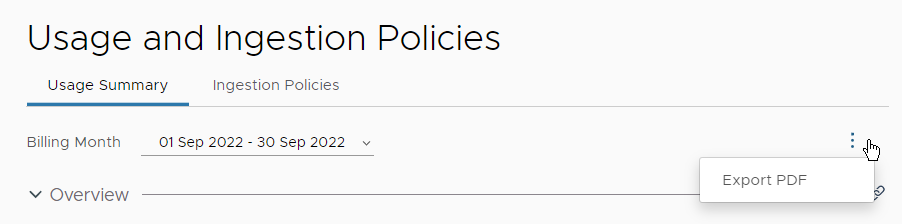
Downloading Usage Portal Dashboards: All users can now export the Usage Summary dashboard and the ingestion policy dashboards in PDF format.
 Important: Ingestion policies do not support metrics from external services. You CANNOT use ingestion policies to monitor PPS usage for services such as the Amazon Web Services, Google Cloud Platform, Microsoft Azure, Snowflake, VMware vRealize Operations Cloud, New Relic, Datadog, and AppDynamics integrations.
 -
Logs (Beta):
Important: Tanzu Observability Logs (Beta) is enabled only for selected customers. If you’d like to participate, contact your Tanzu Observability account representative or technical support.- Improved the search time window when you drill down from the Traces browser into the related logs. By default, the search time window now starts 5 seconds before the trace and ends 5 seconds after the trace, but it’s customizable.
- Added an autocomplete functionality to the search bar, so that you can quickly enter log filters by using the keyboard.
-
Obsolescence Period for Metrics and Sources: The period of inactivity, after which metrics and sources become obsolete, is now customizable. See Obsolete Metrics and Obsolete Sources for details.
-
Delta Counters: We no longer ingest the legacy delta counters as cumulative counter metrics. The original delta counters implementation has reached End of Life on March 31, 2021. See here for details.
-
Integrations: We had an integrations release in November! We added the Tanzu Service Mesh integration and made a lot of improvements to a number of integrations.
2022-44.x Release Notes
-
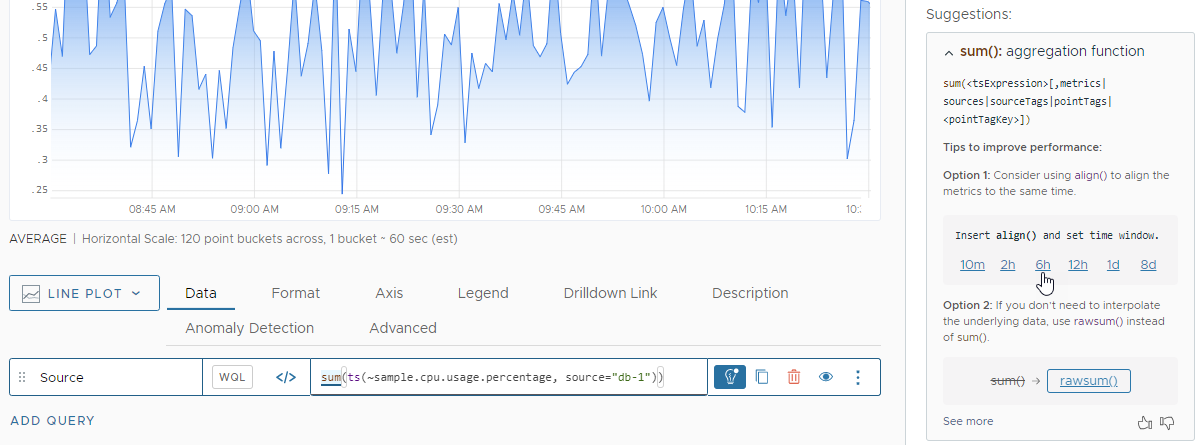
The Query Suggestions for charts and alerts are now actionable. To apply a suggestion and improve the query performance, click a suggestion and your query updates accordingly. See Use Performance Improvement Suggestions for details.
-
We made major improvements to our help docs to fix some issues and include more help pages.
2022-42.x Release Notes
With this release, we launch the Initial Availability of our Logs (Beta) feature.
If the logs feature is enabled on your account:
- You can start sending logs and correlate them with traces and metrics for unified observability and root cause analysis.
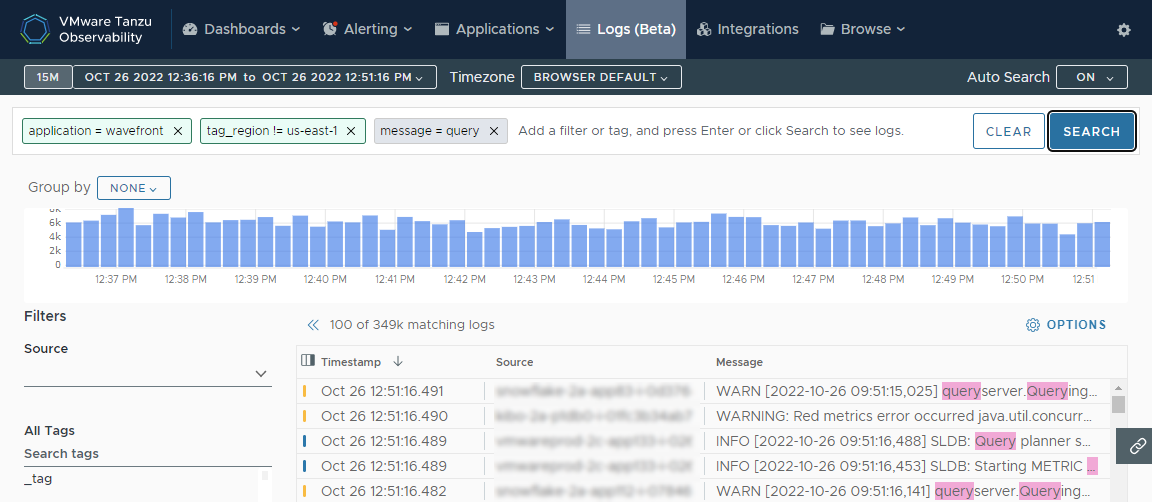
- If you have the Logs permission, you can start using the Logs Browser to examine the ingested logs and find the root cause of critical issues. Click Logs (Beta) on the toolbar or drill into logs from charts, alerts, and traces. See Get Started with Logs (Beta) for details.
- You can use the Linux Host and Wavefront Usage integrations that we improved for logs. See the Integrations Release Notes for details.
2022-41.x Release Notes
-
Accessibility Improvements: With this release we have made a lot of accessibility-related fixes. For example:
- Added meaningful texts for screen readers to all of our pages and UI elements, such as buttons, form fields, data tables and their structure elements, and so on.
- Fixed color coding and contrast.
- Forms and form fields now contain instructions and all required fields are marked as such. In addition, we’ve made fixes to the error messages and their color coding and associated them with the appropriate form fields.
- We’ve added alternative texts for all images used in the UI.
- When you navigate to a page in the UI, we’ve added the appropriate name on the browser page as well. For example, when you create a new chart, on the browser you’ll see New Chart | Tanzu Observability.
-
Dashboard Performance Improvements: Previously, by default, the Show Events option was enabled to show the events from charts. This could increase the total query time of a dashboard. With this release, when you create a dashboard, by default the Show Events option is set to None. You can change this setting based on your needs. See Control Event Overlays for details and screenshots.
-
Wavefront Top: We have released the 1.2 version of the wftop utility that has fixes for multiple CVE issues.
-
Wavefront Proxy: We’ve just released Wavefront Proxy 12. For details on the changes, see the Wavefront proxy GitHub page.
-
Integrations: We had an integrations release in October! We made a lot of bug fixes and improvements to a number of integrations, including the Wavefront Usage integration. See the Integration Release Notes for details.