Summary
integral(<tsExpression>)
Returns the moving sum for each time series, over the time window set for the current chart.
Parameters
| Parameter | Description |
|---|---|
| tsExpression | Expression that describes the time series you want moving sums for. |
Description
The integral function returns the moving sum for each time series described by the expression, over the time window set for the current chart. The function always returns 0 at the left side of the chart, and shows the total accumulation over the duration of the chart’s time window.
The function is useful for determining trends, for example, whether the total number of requests per minute increased, or whether new sources were added to meet demand. For example, you might want to know how much traffic you serve in a day. By looking at the slope that results from the call to integral, you can see where traffic grows the fastest.
In contrast to integrate, this function depends completely on the time window that you’re currently looking at.
Note: This function considers time window boundaries inclusive. For example, when used with a 10 minute time window and with data that are returned once a minute, integral() returns the sum for 11 minutes.
Examples
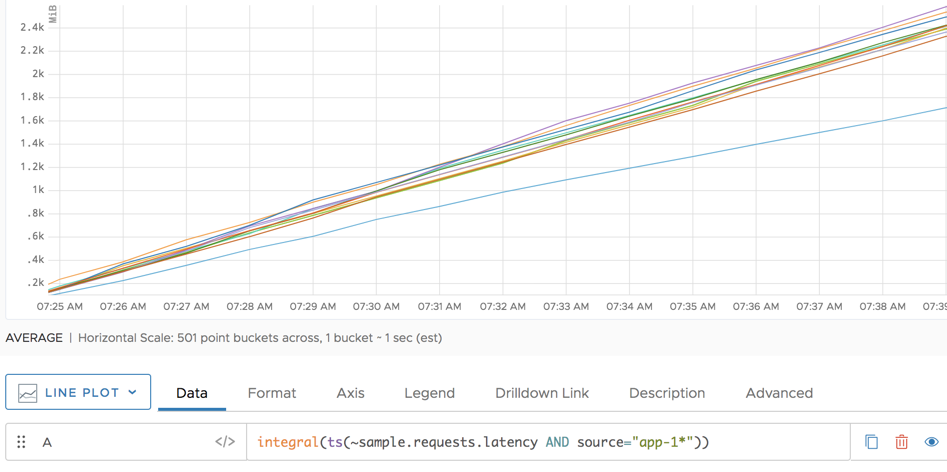
The following example shows how integral() sums all sources that start with app-1* over the current time window.

Caveats
The integral() function depends on the window size and is not compatible with at(). Applying at() to the results of integral() may produce unexpected results. Use the msum() function with a 1vw time window argument instead.