Summary
exists(<tsExpression>)
Returns 1 if any time series described by the expression exists, and returns 0 otherwise. A time series exists if it has reported a data value in the last day (24 hours).
Parameters
| Parameter | Description |
|---|---|
| tsExpression | Expression describing the time series to be tested for existence. |
Description
The exists() function returns 1 if any time series described by the expression exists, and returns 0 otherwise. A time series exists if it has at least one value that was reported within the last day (24 hours). The returned constant series is continuous.
You can use exists() to see if a metric is obsolete or has never reported.
exists() is useful if you’re creating a query that uses a metric that is planned but has not yet started reporting, for example, when you’re building a dashboard before any data is sent. Unless you wrap the query in exists(), all your charts will show errors for the missing metric. Using exists allows any syntax errors to be reported, which help you make corrections, but suppresses the errors for the missing metric.
exists() function returns true. We are working on addressing this issue.Examples
You can wrap exists() around an expression that returns some number of time series, like this:
exists(ts(inv_1_get_count, status="7**" and operation="*" and cname="${environment}"))
This query returns 1 if at least one time series has a value reported within the 1d (24 hours). Otherwise, the query returns 0 if the values of all of the time series are older than 1d (24 hours).
Because this query returns either 1 or 0, it is useful as a conditional expression in an if() function.
For clarity, we’ll name this query hasData so we can easily refer to it in the example below.
This example tests hasData to see whether its underlying metrics are reporting data, and uses the result to choose between two other previously defined queries named queryOfInterest and substituteQuery:
if(${hasData}, ${queryOfInterest}, ${substituteQuery})
In this example:
hasDataevaluates to 1 (true) if its underlying metrics are reporting, soif()returns the results ofqueryOfInterest.hasDataevaluates to 0 (false) if its underlying metrics are not reporting, soif()returns the results ofsubstituteQuery.
Using Exists() with Nested if/else Statements
When you create a query with exists(), you sometimes do not get the result you expected. The reason is that series matching occurs if a query uses exists() with nested if/else statements, and both expressions return data. This section explains how to get for results without series matching.
Use Case
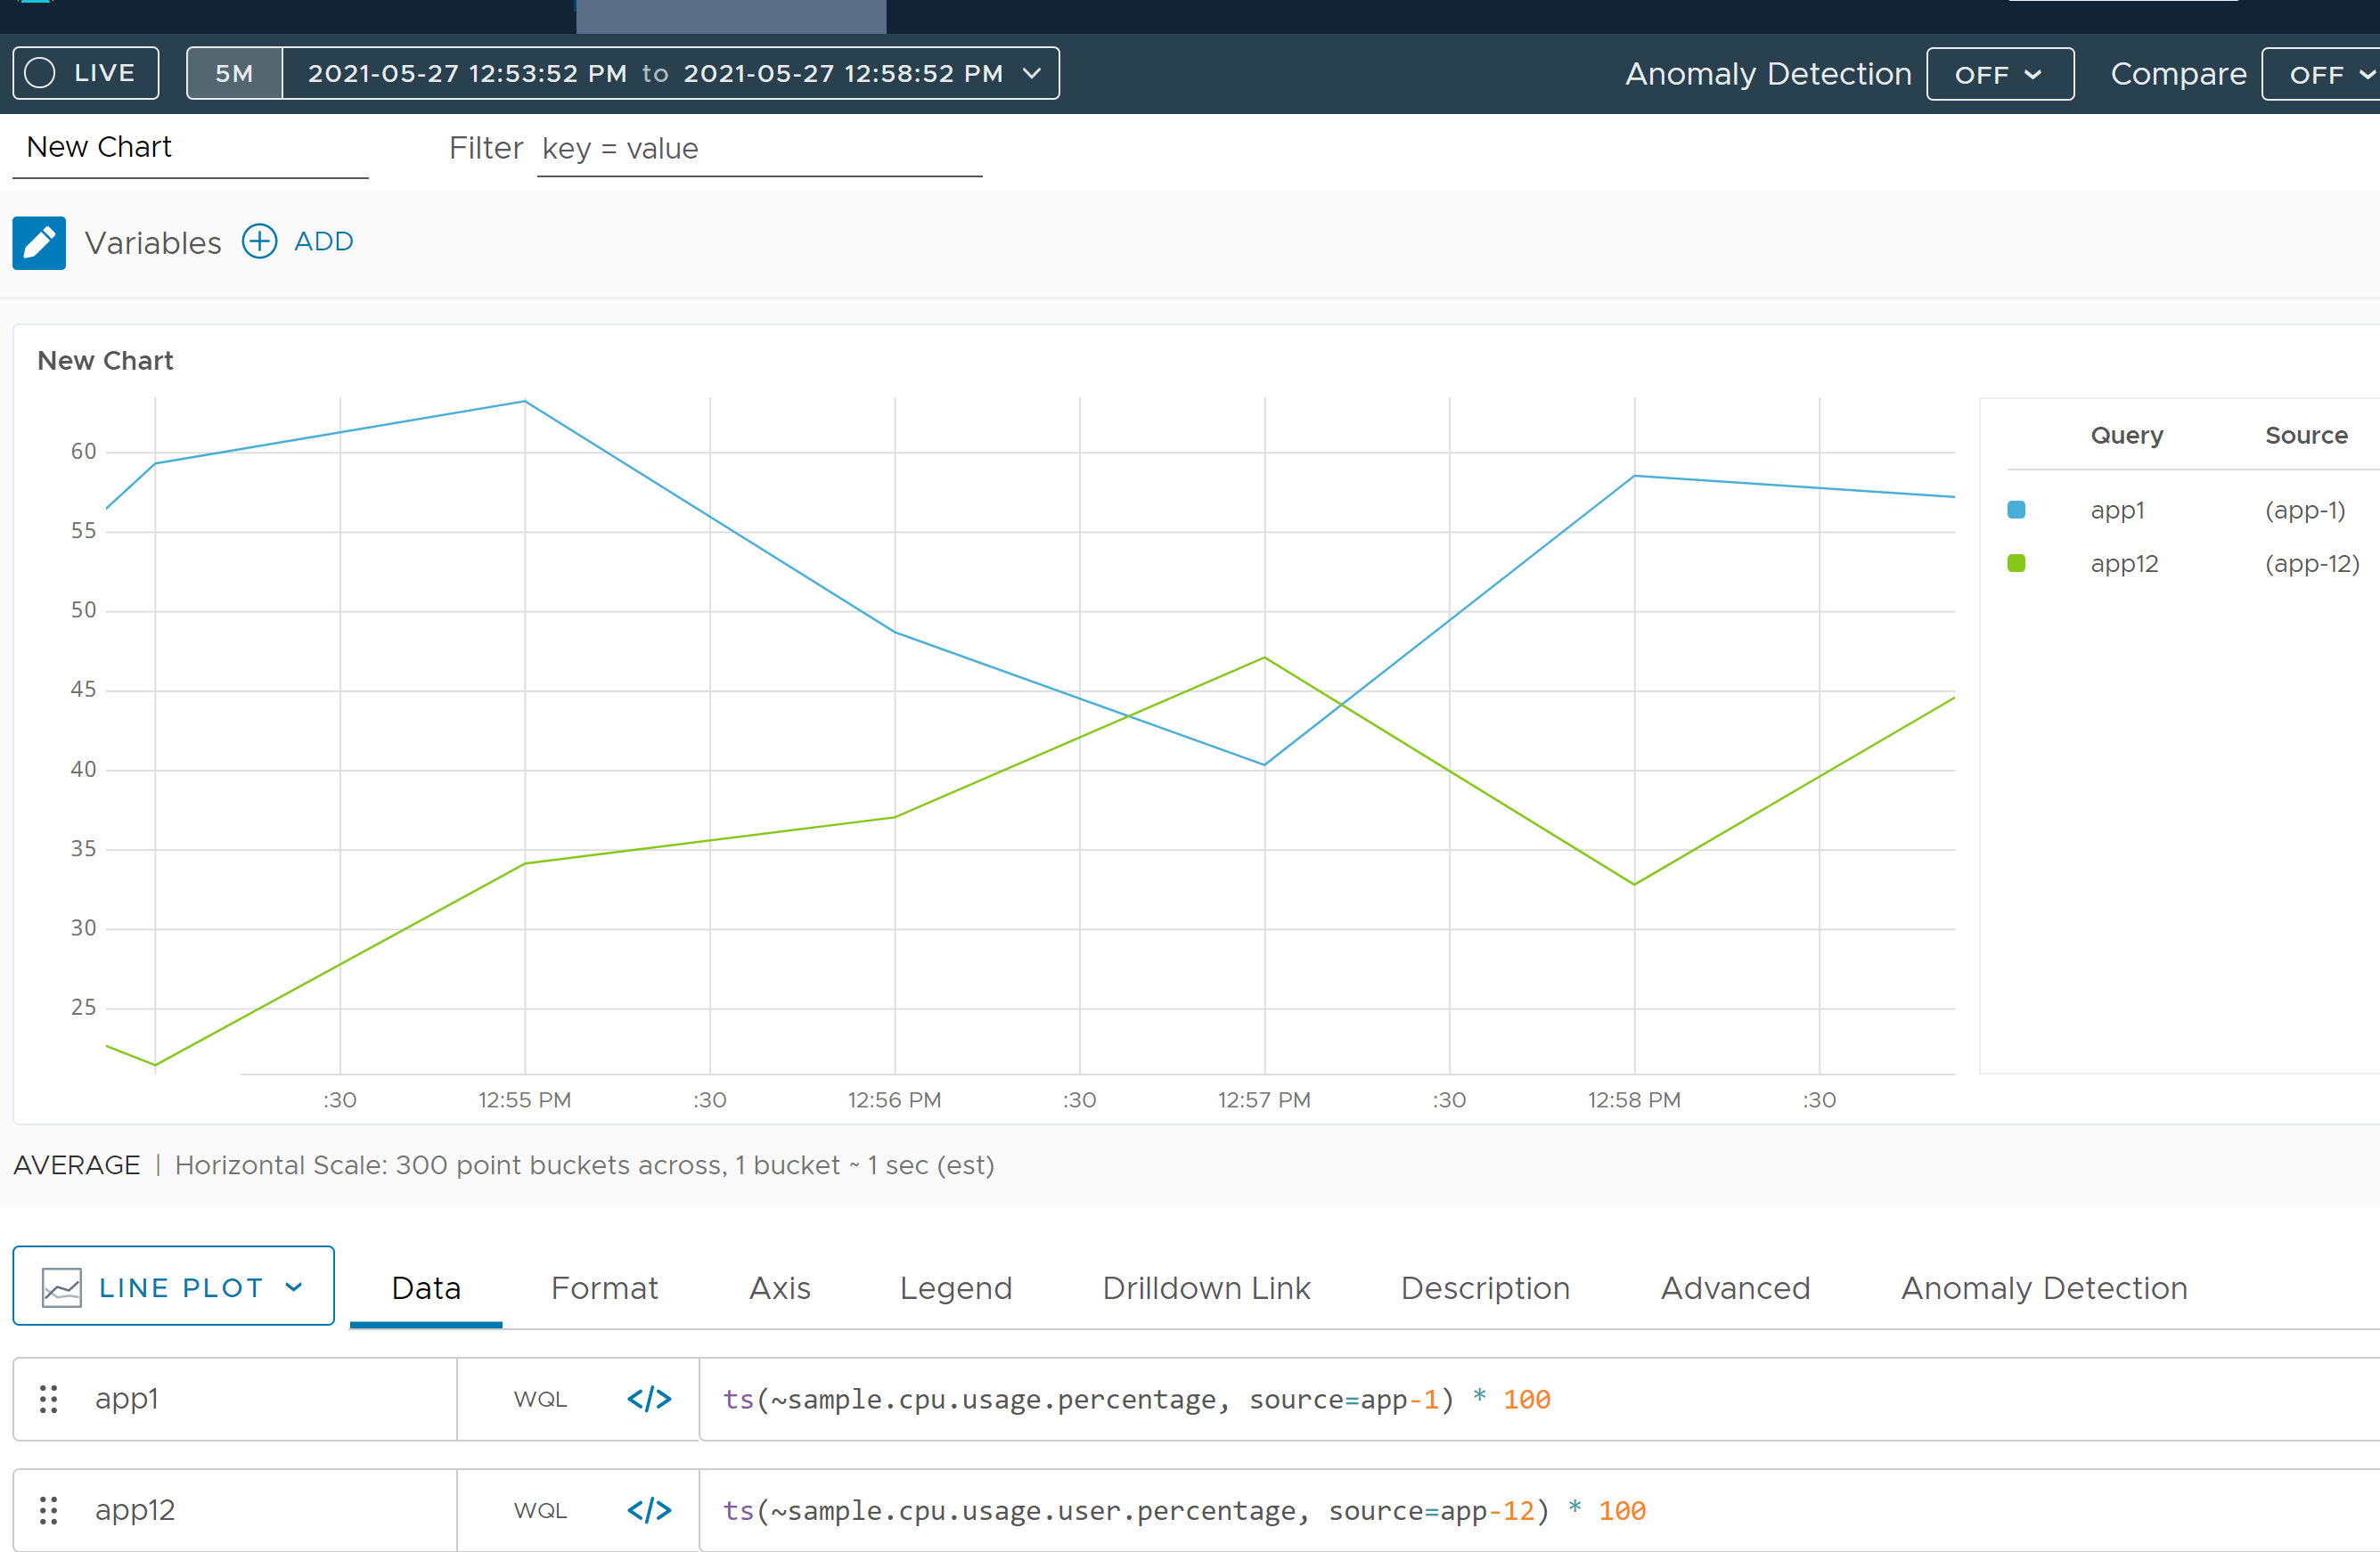
We’ll use the sample metric data ~sample.cpu.usage.percentage and ~sample.cpu.usage.user.percentage to demonstrate the nested if/else series matching in action.
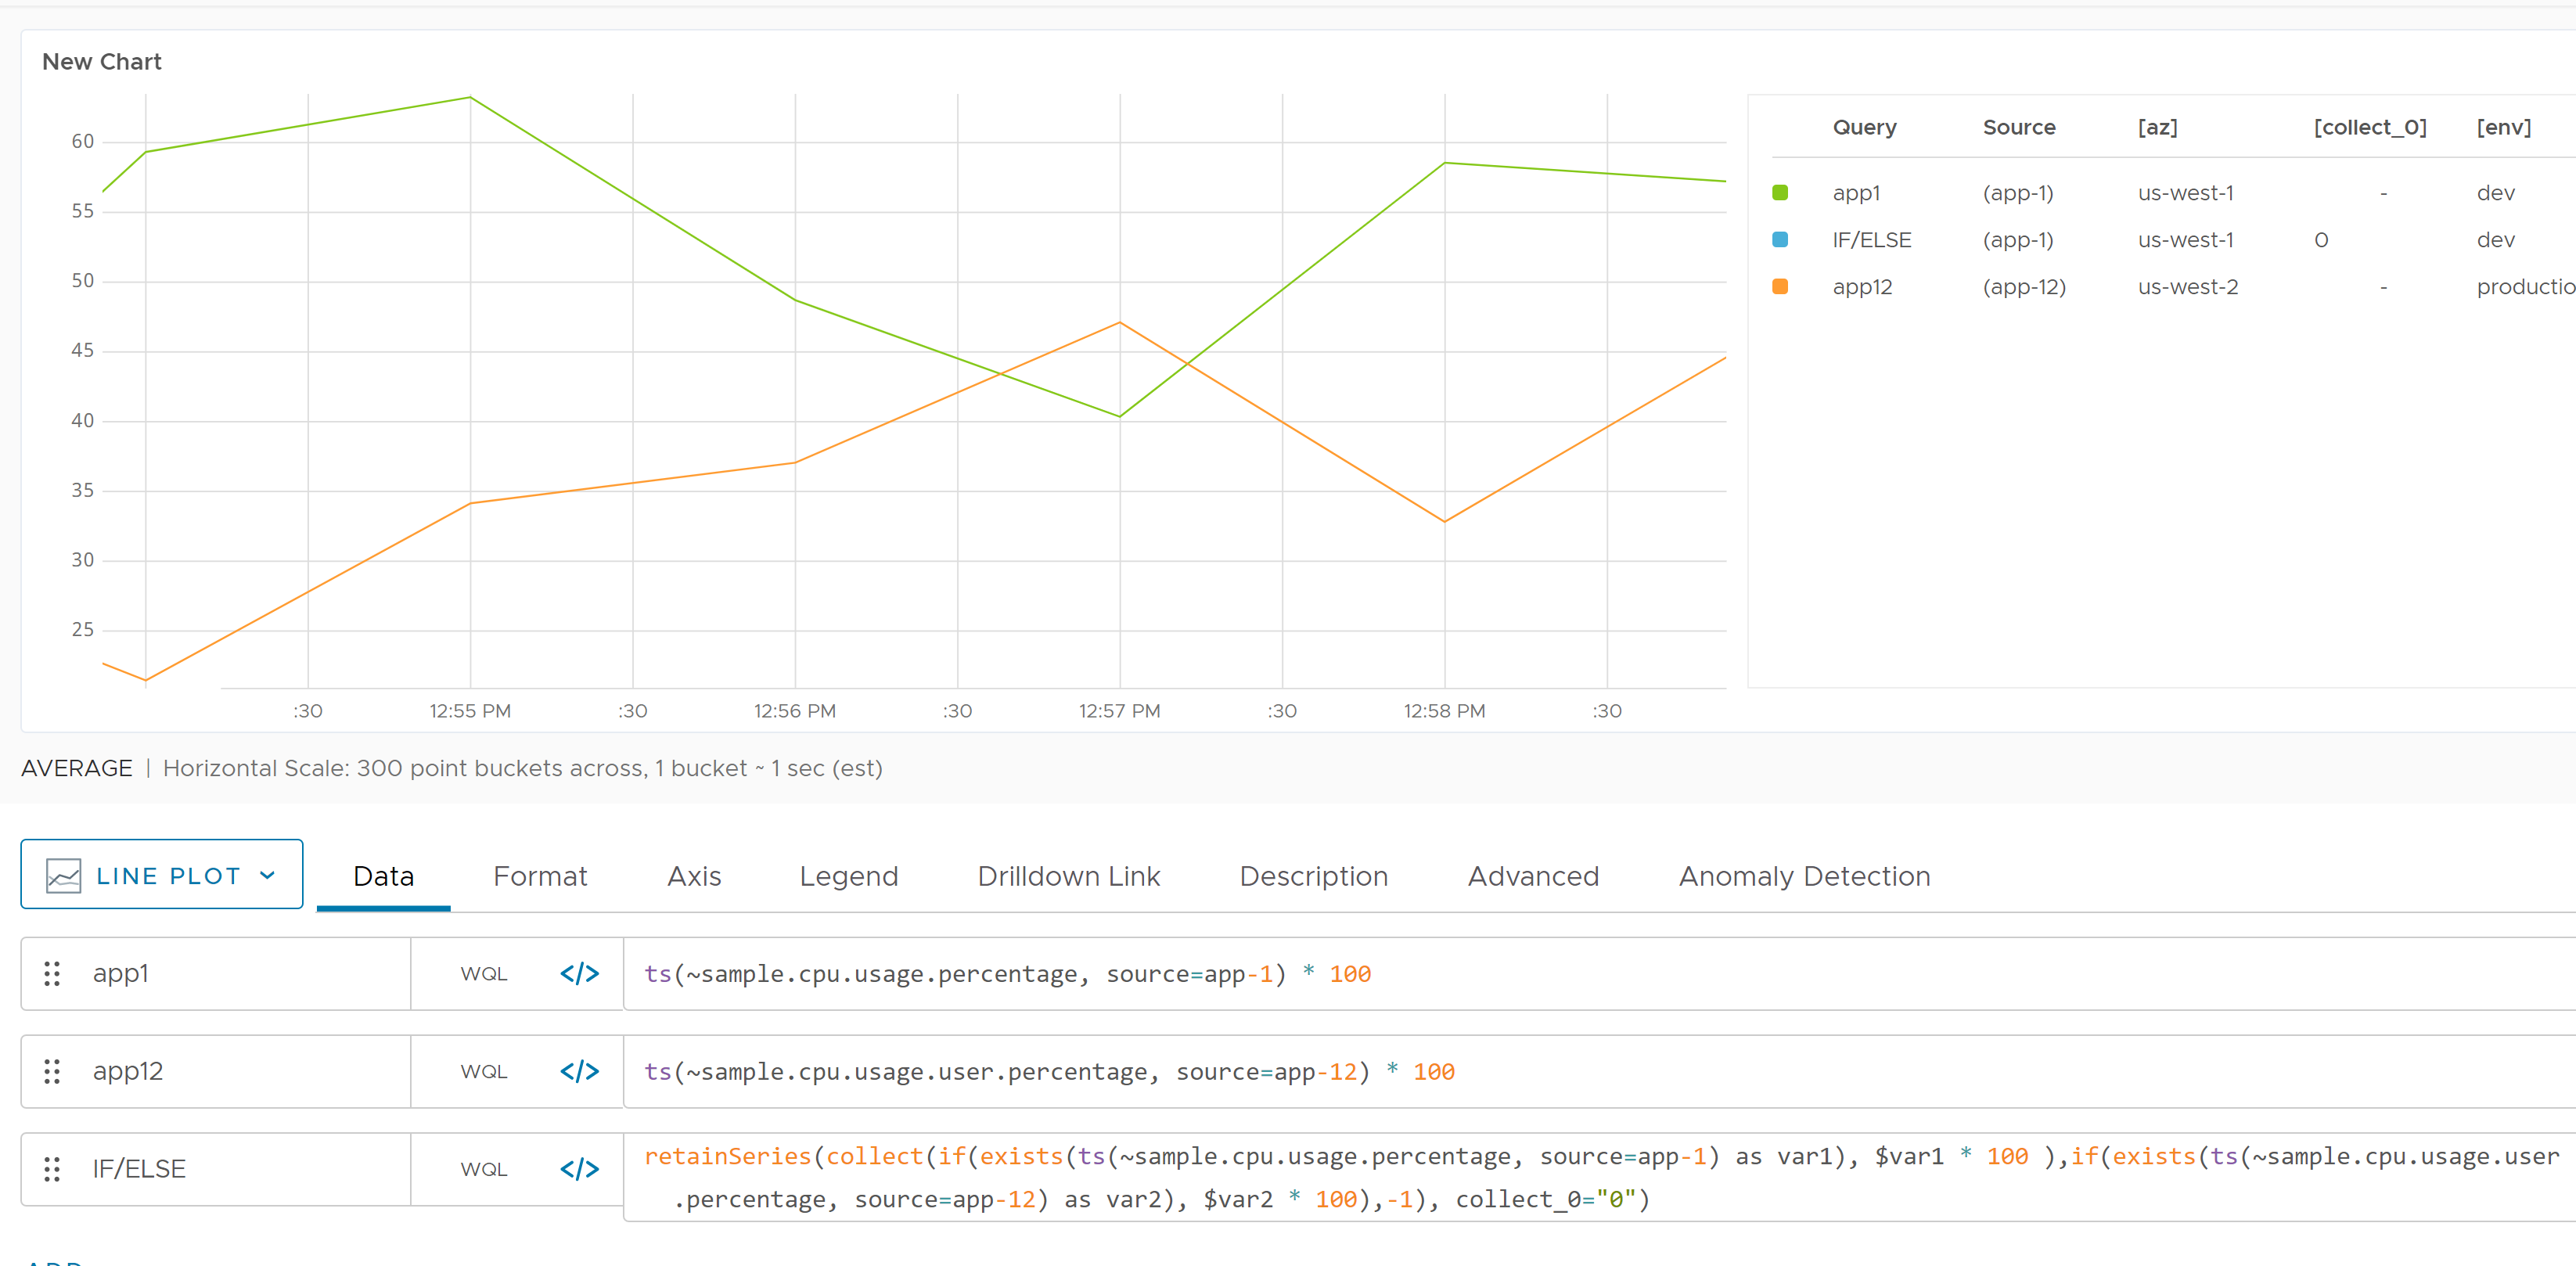
The following screenshot uses the two sample metrics coming from two sources, app-1 and app-12. Both metrics values are multiplied by 100 for demonstration purposes.
Suppose:
- You want to display the
~sample.cpu.usage.percentagemetric from app-1 (multiplied by 100), if the metric exists. - Else if the metric does not exist, you want to display
~sample.cpu.usage.user.percentagefrom app-12 (multiplied by 100), if that metric exists. - If neither metric exists you want to display -1.
Here’s how that query looks (we’ve included line breaks for legibility):
if(exists
  (ts(~sample.cpu.usage.percentage, source=app-1)),
   ts(~sample.cpu.usage.percentage, source=app-1) * 100,
if(exists
  (ts(~sample.cpu.usage.user.percentage, source=app-12)),
   ts(~sample.cpu.usage.user.percentage, source=app-12) * 100,
-1))
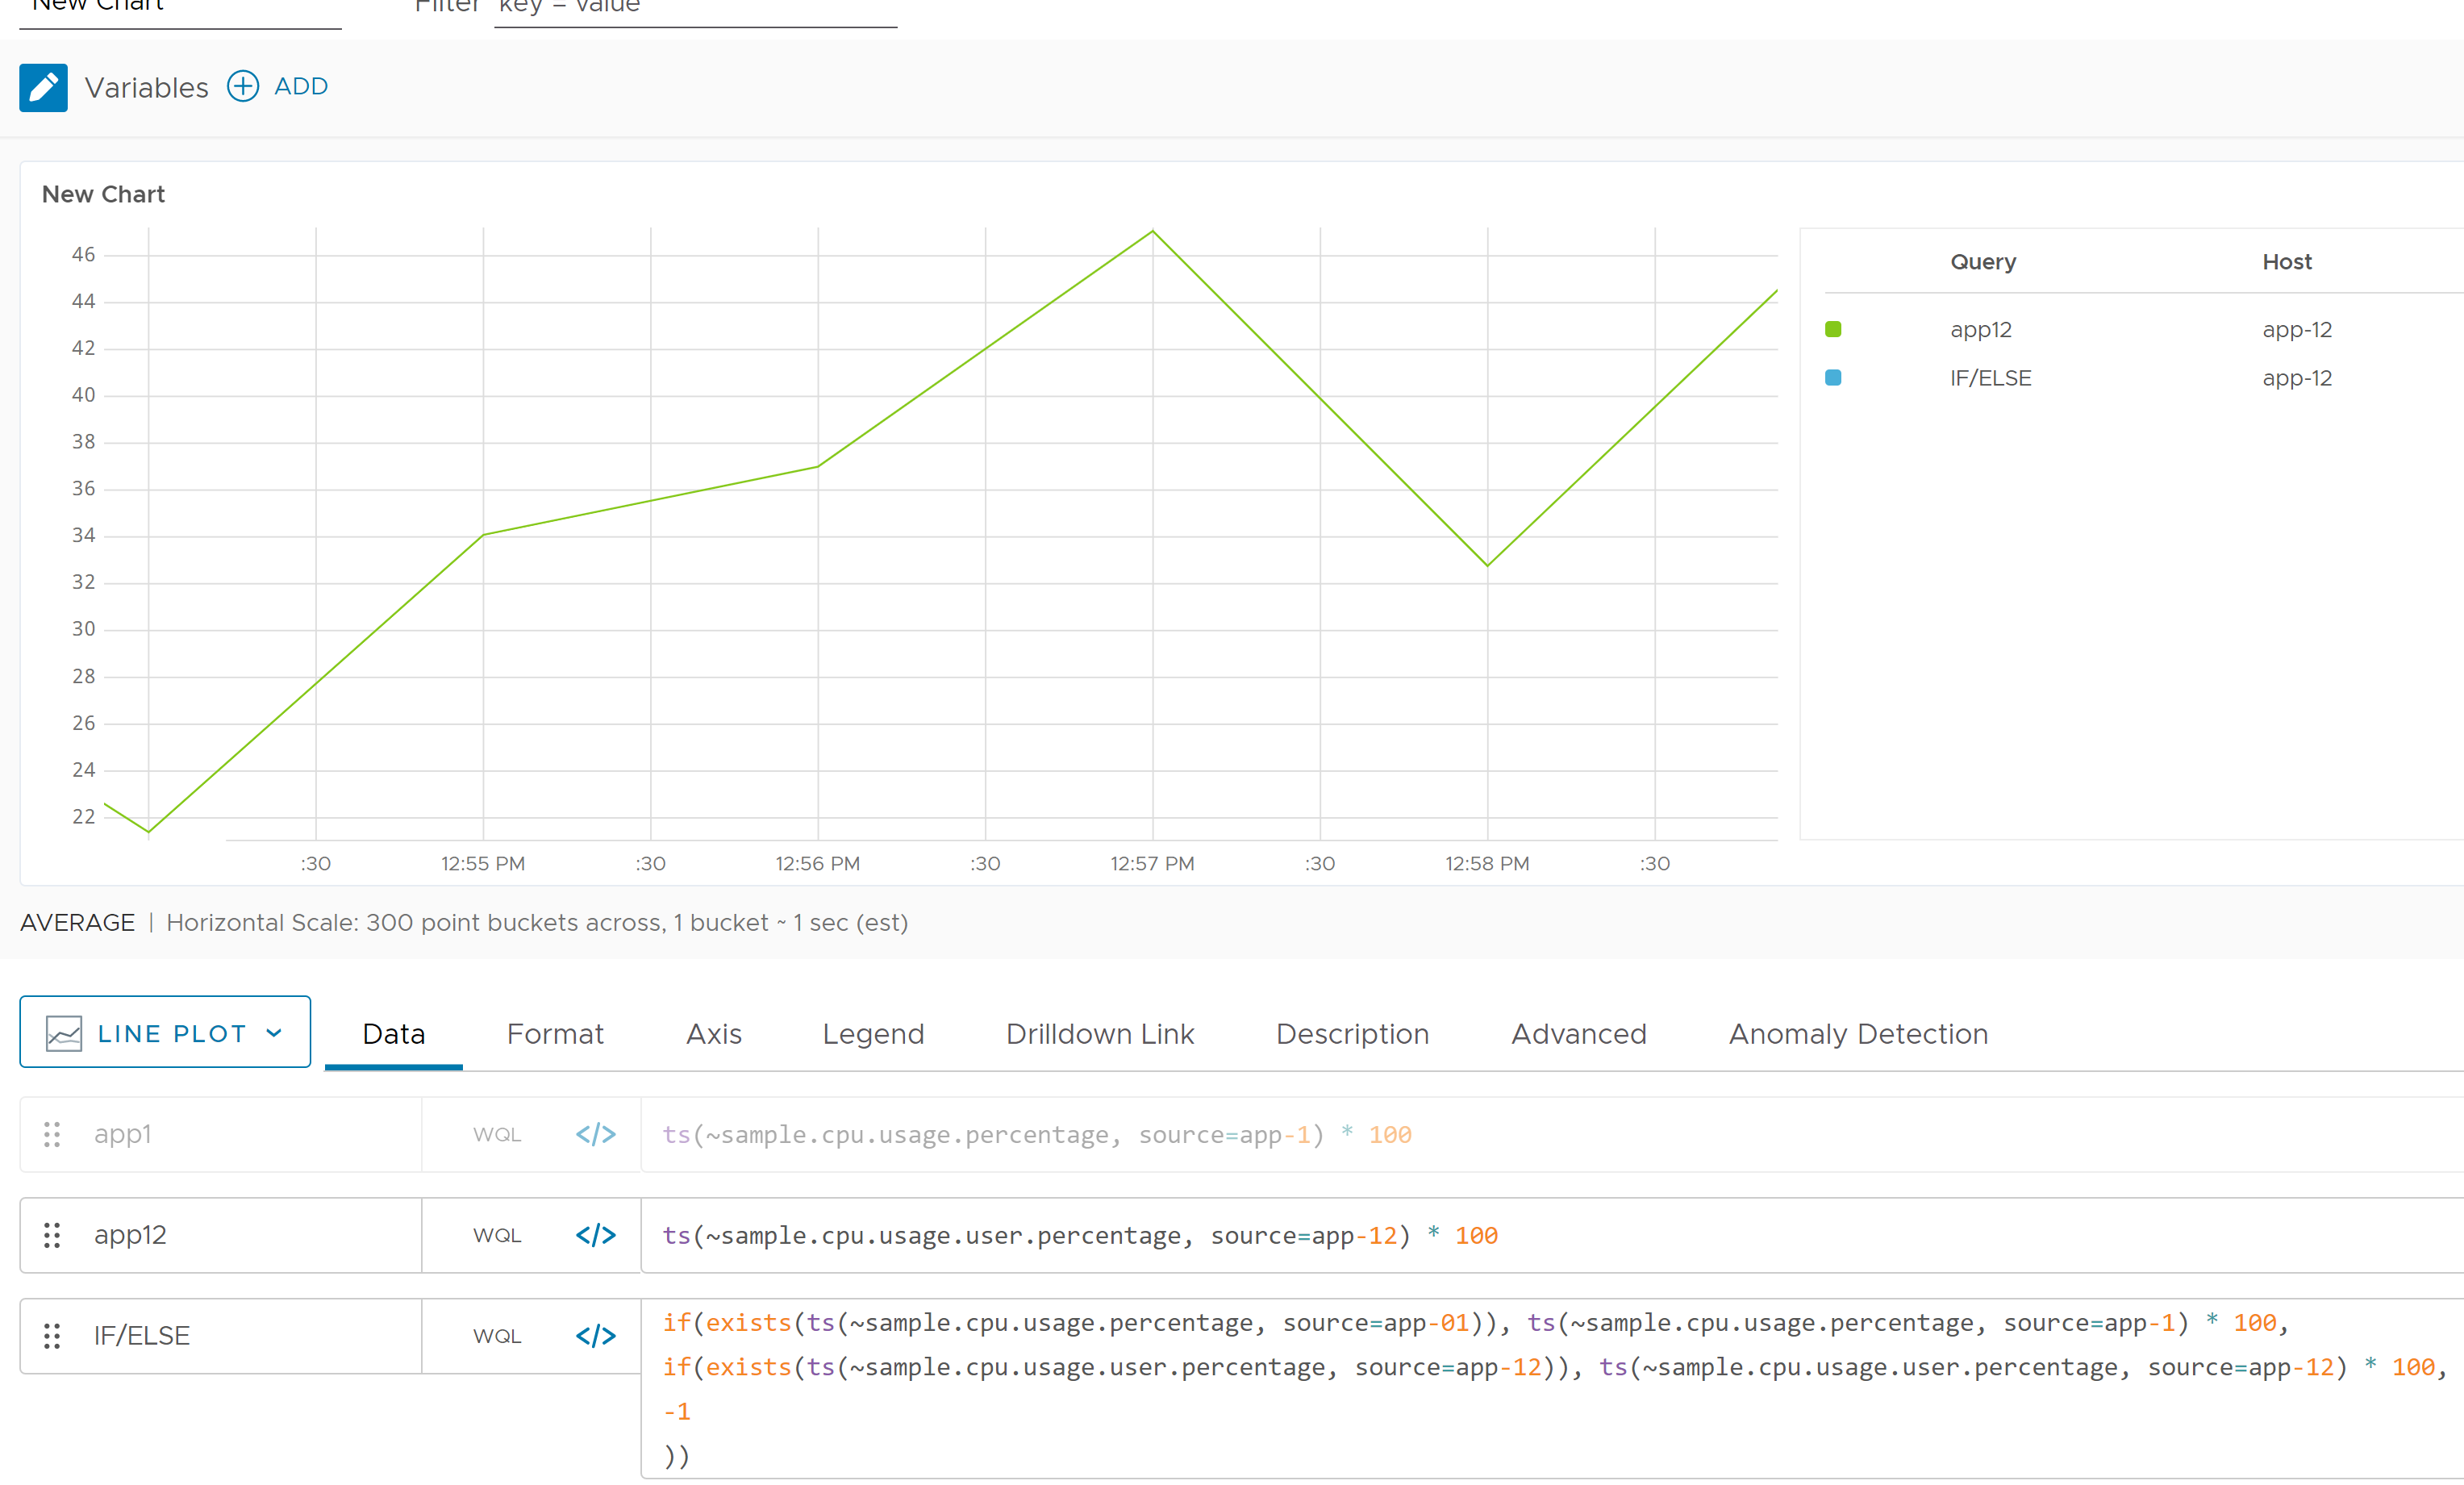
To test the query output, let’s use this query and make the first if statement false by using a source that doesn’t exist, app-01.
if(exists
  (ts(~sample.cpu.usage.percentage, source=app-01)),
   ts(~sample.cpu.usage.percentage, source=app-1) * 100,
if(exists
  (ts(~sample.cpu.usage.user.percentage, source=app-12)),
   ts(~sample.cpu.usage.user.percentage, source=app-12) * 100,
-1))
Because app-01 doesn’t exist, we expect to see only the line for ~sample.cpu.usage.user.percentage. The screenshot below verifies that’s what we see.
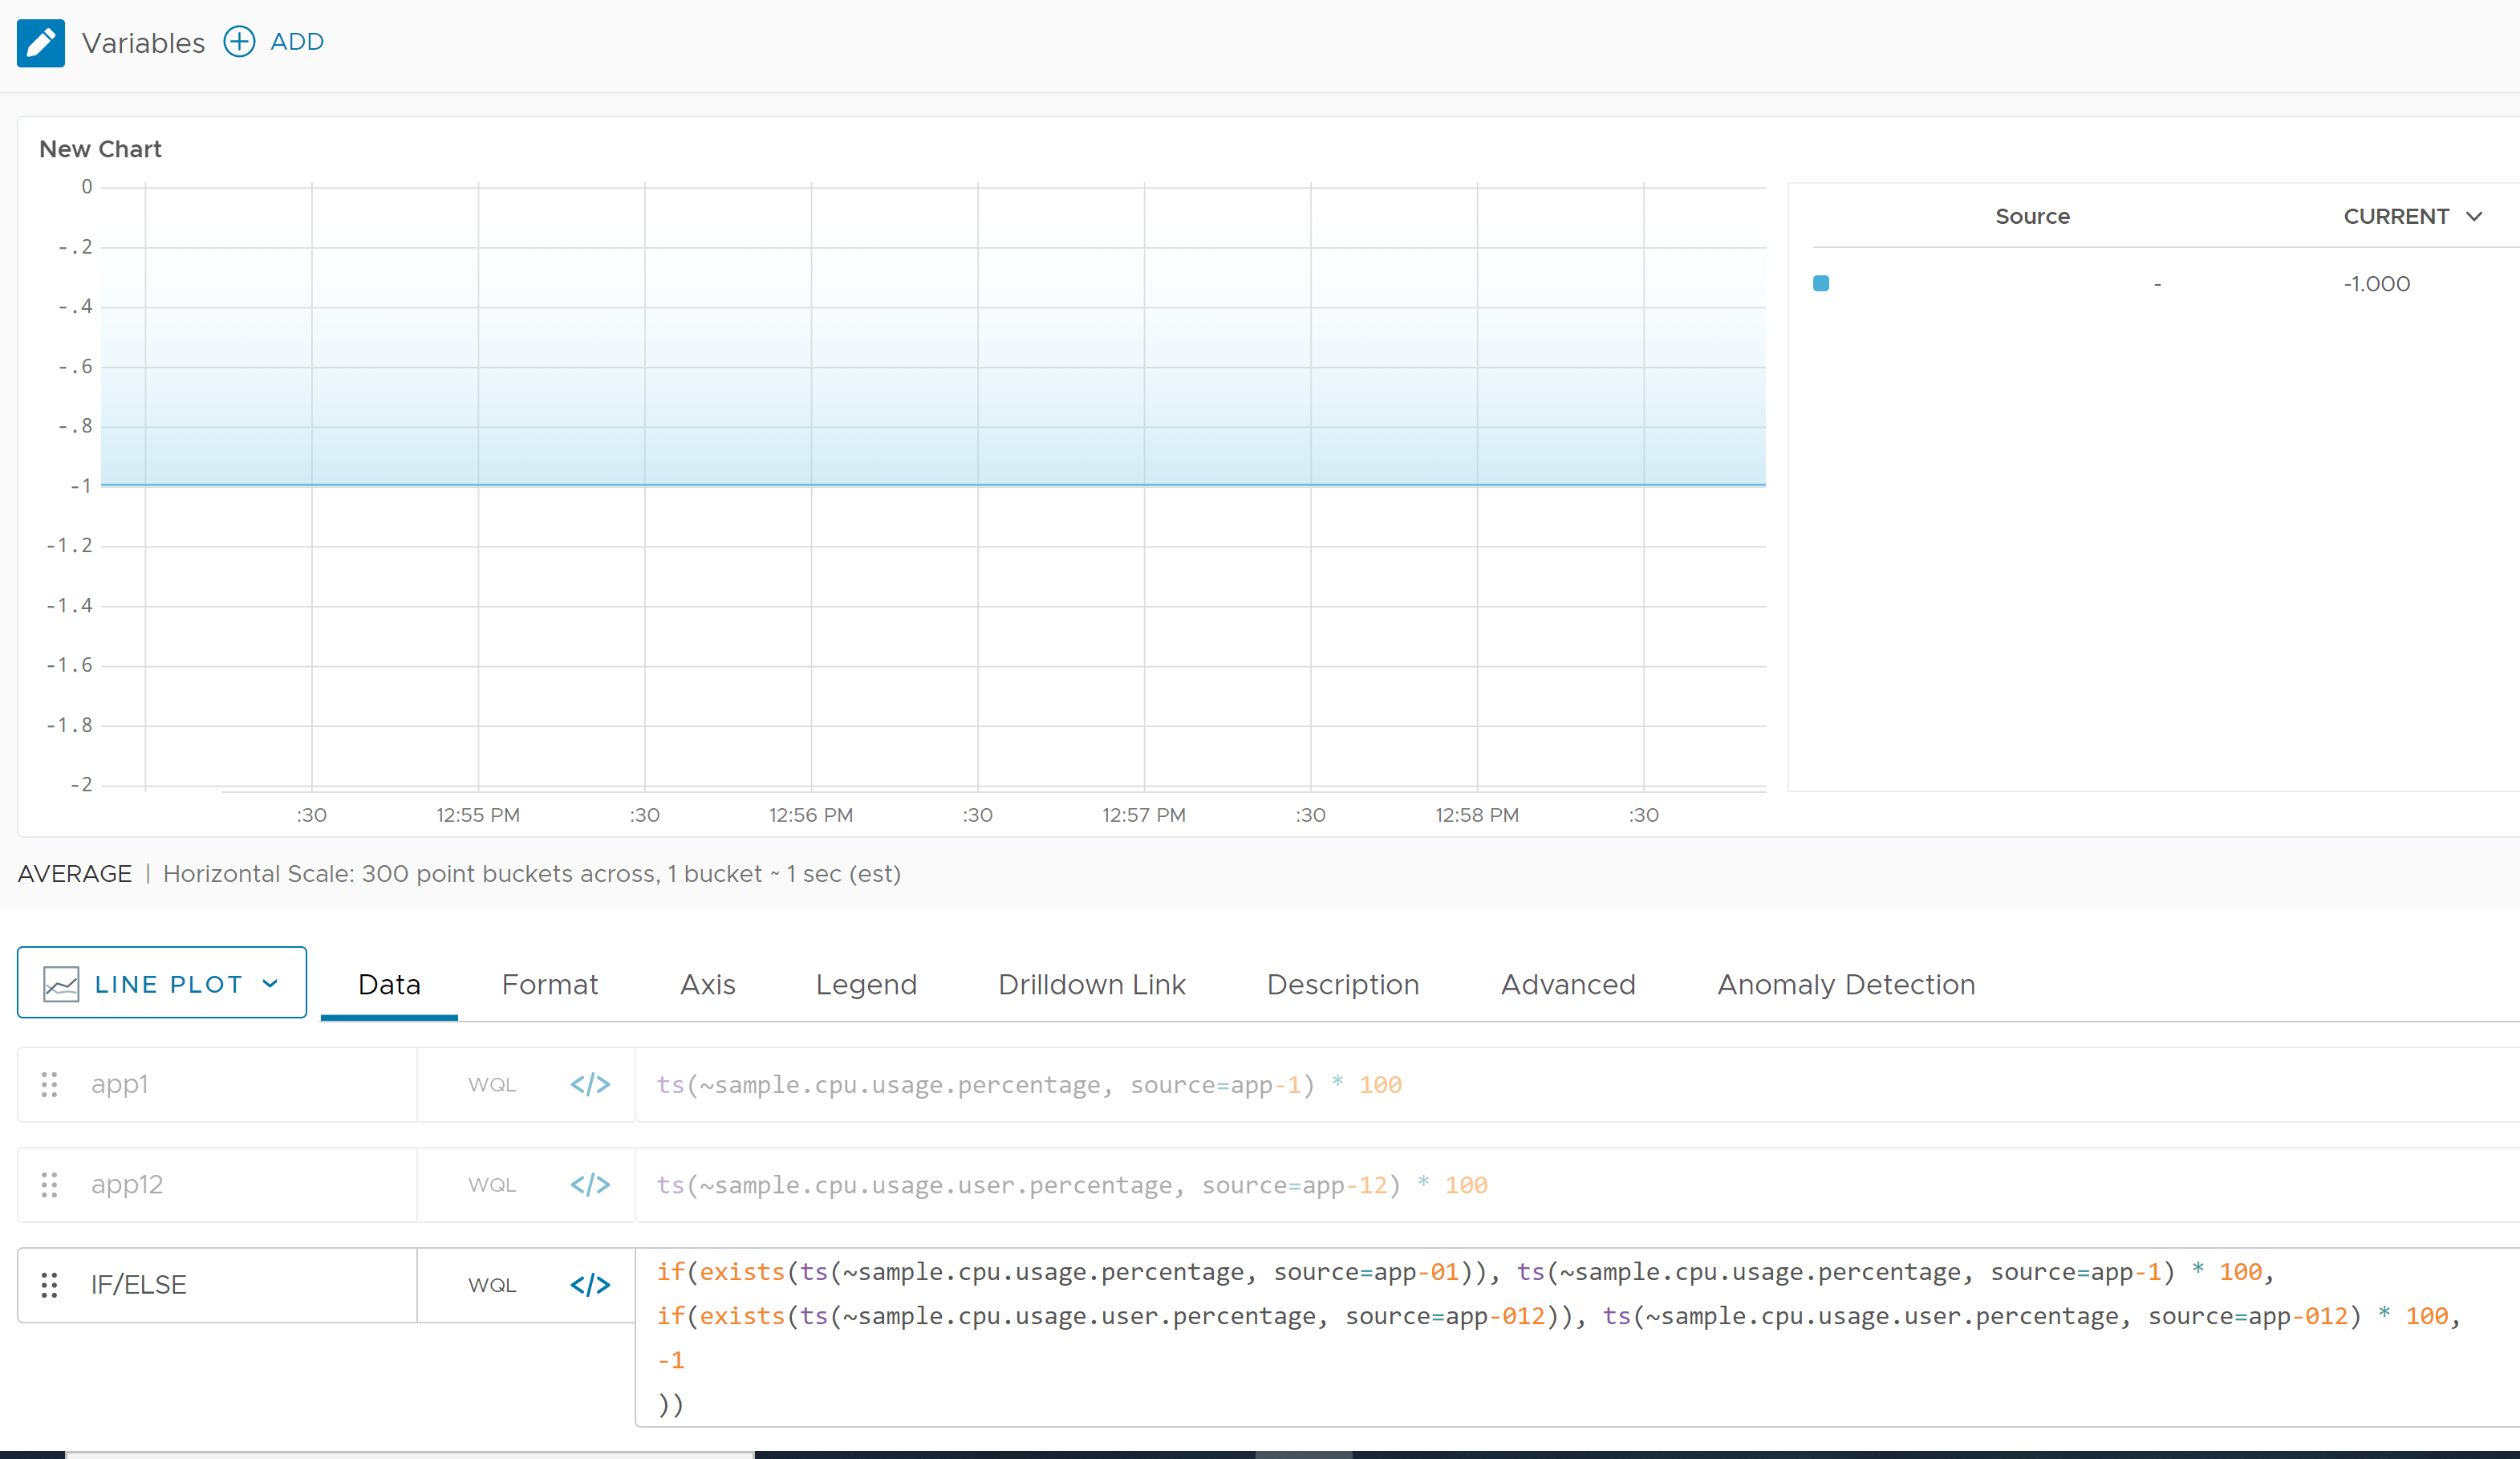
If we use a source that doesn’t exist with both queries, we expect to see -1:
if(exists
  (ts(~sample.cpu.usage.percentage, source=app-01)),
   ts(~sample.cpu.usage.percentage, source=app-1) * 100,
if(exists
  (ts(~sample.cpu.usage.user.percentage, source=app-012)),
   ts(~sample.cpu.usage.user.percentage, source=app-012) * 100,
-1))
So the nested if/else statements work as expected when one or more of the metrics does not exist.
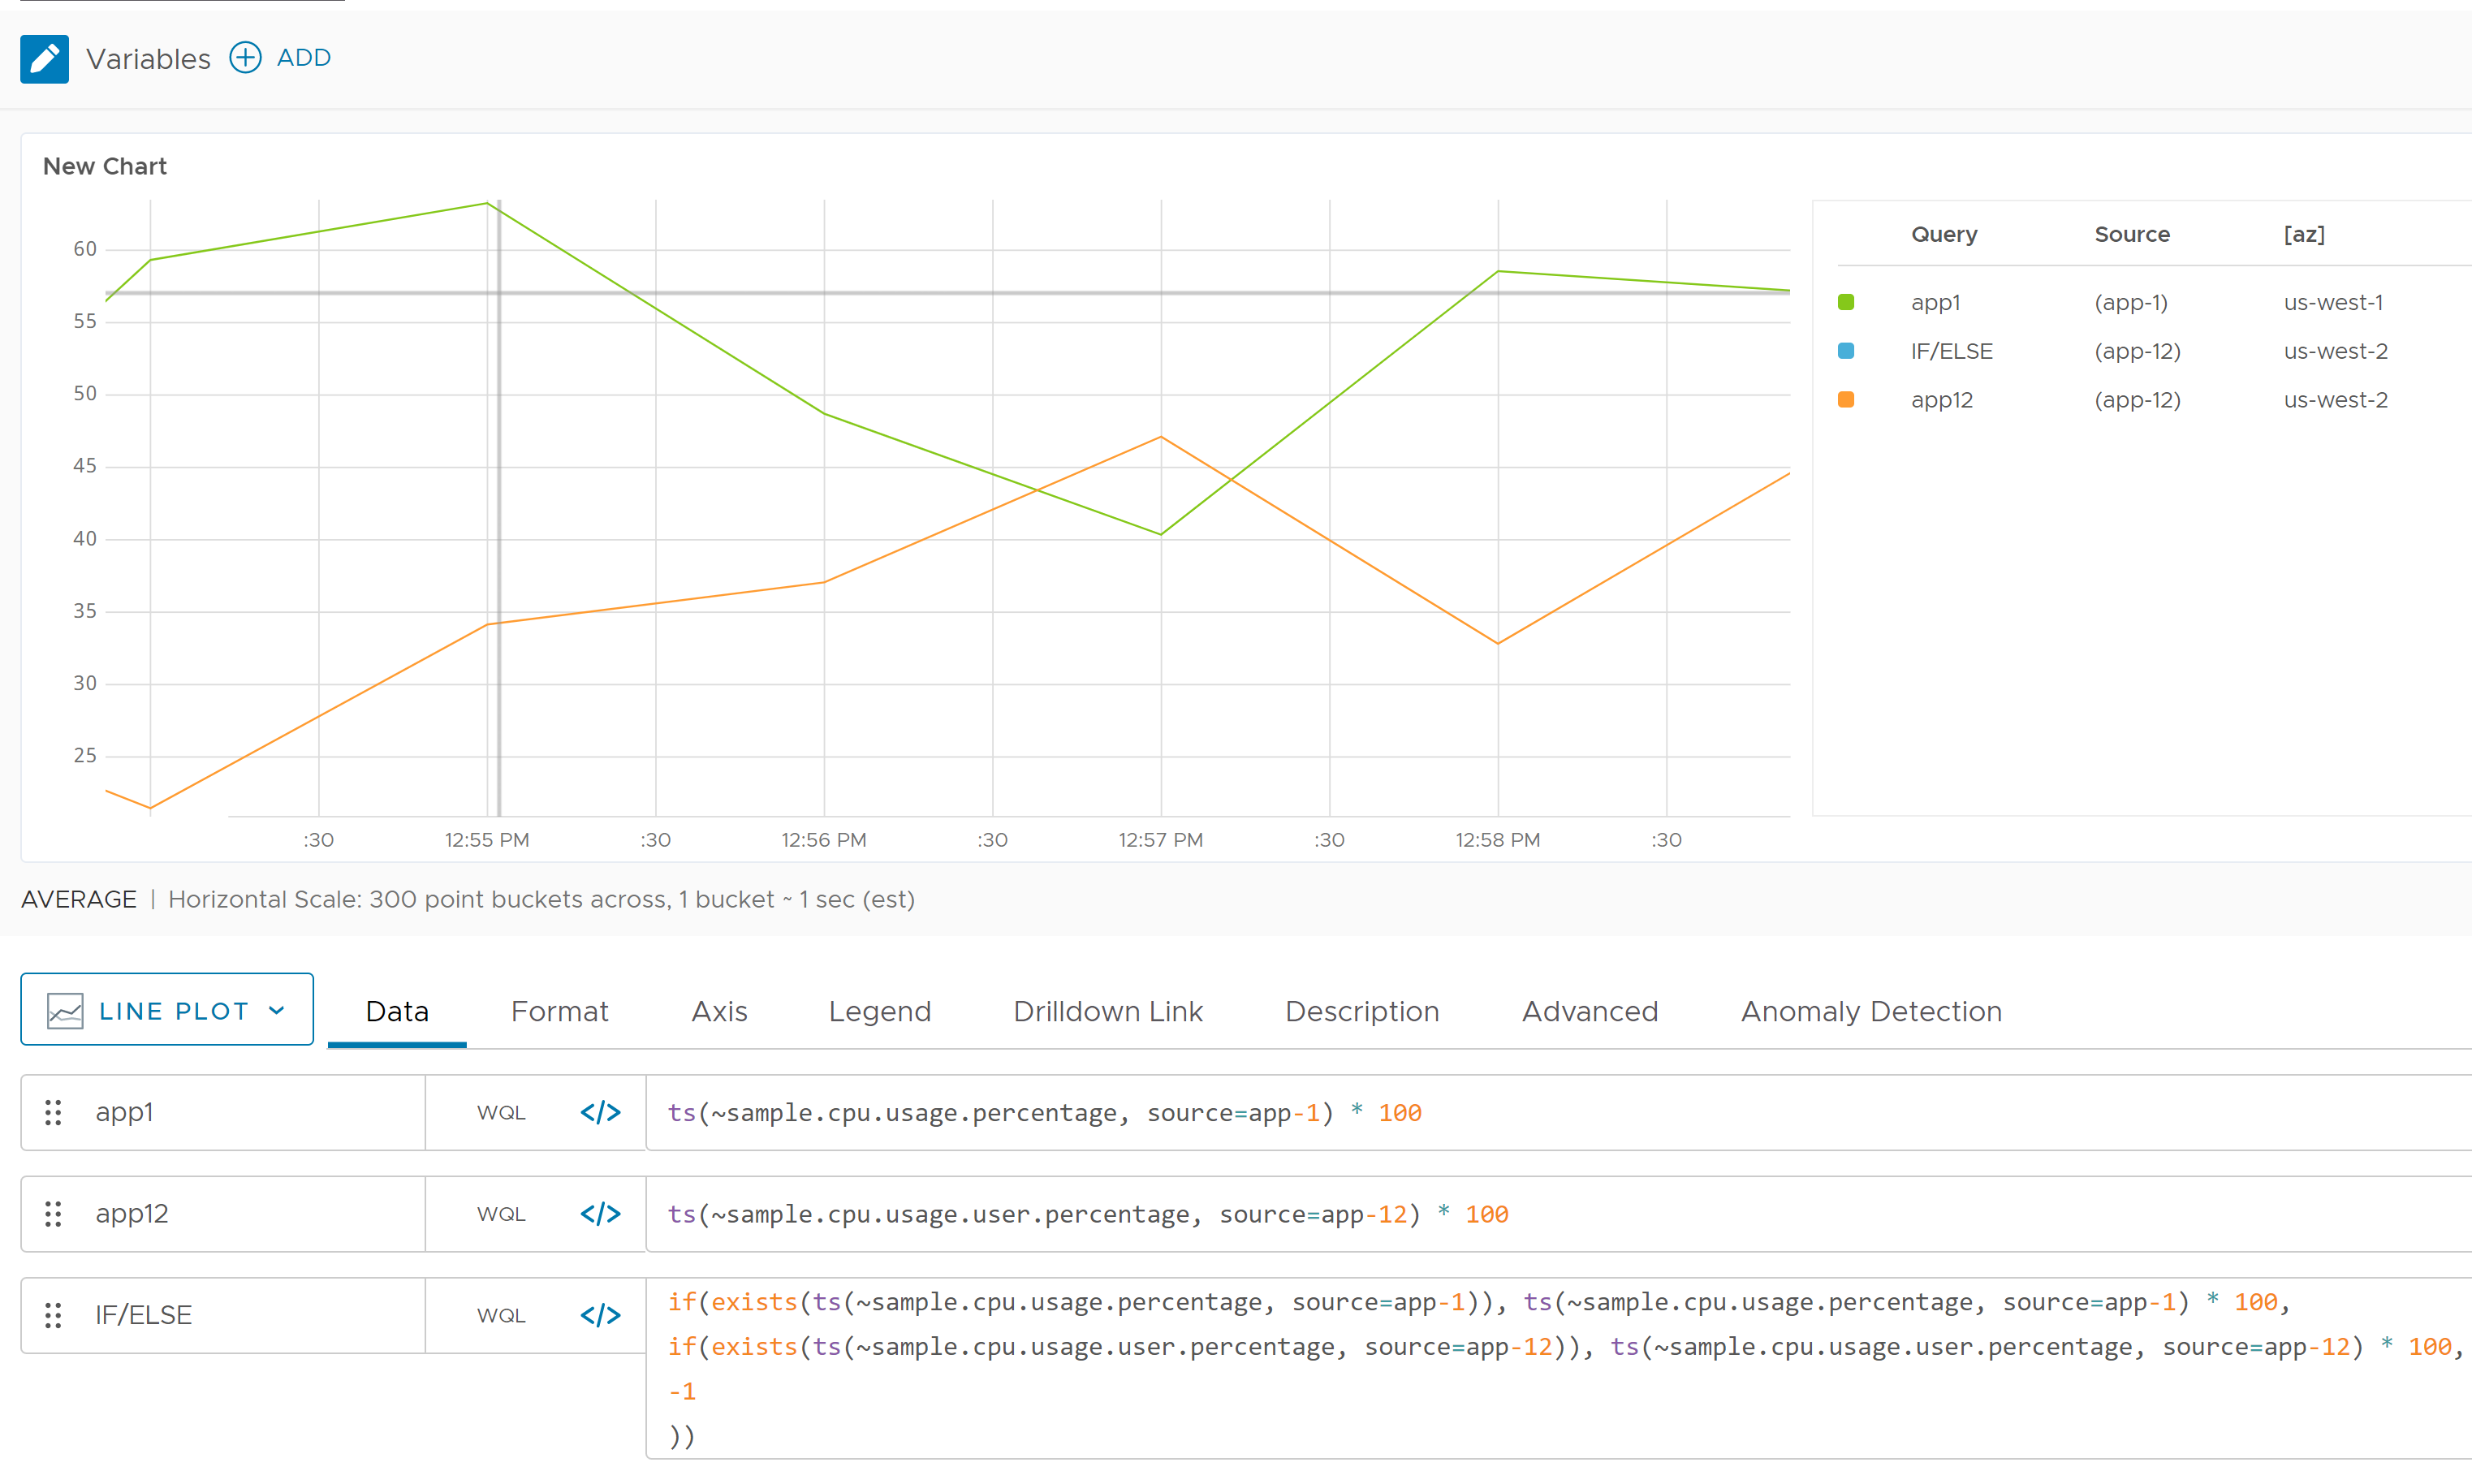
However, when both metrics exist in a nested if/else expression, then the results you see can be confusing because series matching occurs. In the following screenshot, the if/else query should show the value for app-1 (first condition) but shows the value for app-12 (second condition).
Workaround for Exists() Corner Cases
One way to workaround the exists() and nested if/else series matching problem, is to use a combination of the retainSeries() and collect() functions to ensure the displayed output follows a traditional nested if/else logical output.
With the same metrics we used above, we could write the following query (including line breaks for legibility):
retainSeries(collect(
  if(exists
      (ts(~sample.cpu.usage.percentage, source=app-1) as var1), $var1 * 100 ),
  if(exists
      (ts(~sample.cpu.usage.user.percentage, source=app-12) as var2), $var2 * 100),
  -1),
collect_0="0")
This expression ensures that the nested if/else works correctly for all queries.
See Also
The missing() function lets you check whether a function returned data in a specified time window.