Summary
align(<timeWindow>,[mean|median|min|max|first|last|sum|count,] <tsExpression>)

align(<timeWindow>, <hsExpression>)
You can use align() with time series and with histograms.
| Time series function |
Groups the data values of a time series into buckets of size timeWindow, and returns one displayed value per bucket. Each returned value is the result of combining the data values in a bucket using the specified summarization method. |
| Histogram function |
Groups the distributions of a histogram series into time buckets of size timeWindow, and returns a single merged histogram distribution per bucket. In a time-series chart, align() displays just the median values of the resulting distributions. |
Parameters
Time-series Function
| Property | Description |
|---|---|
| timeWindow | Size (duration) of the buckets into which data values are grouped. You can specify a time measurement based on the clock or calendar (1s, 1m, 1h, 1d, 1w), the window length (1vw) of the chart, or the bucket size (1bw) of the chart. Default is minutes if the unit is not specified. |
| mean|median|min|max|first|last|sum|count | Summarization method to use for aggregating the data values within each bucket. These are similar to the Summarize by options that you can set for a chart. Default is mean (average). |
| tsExpression | Expression describing the time series to organize into buckets. |
Histogram Function
| Parameter | Description |
|---|---|
| timeWindow | Size (duration) of the buckets into which histogram distributions are grouped. You can specify a time measurement based on the clock or calendar (1s, 1m, 1h, 1d, 1w), the window length (1vw) of the chart, or the bucket size (1bw) of the chart. Default is minutes if the unit is not specified. |
| hsExpression | Expression describing the histogram series to organize into buckets. |
Description
You can use align():
- With time series.
- With histogram series.
Time-series Function
The align() time-series function adjusts the display of each time series described by the expression, by grouping the data values into buckets of the specified duration and then returning a single displayed value for each bucket.
By default, each returned value is the mean (average) of the values that were reported in a bucket. You can specify a different summarization method if you want the bucketed values to be aggregated in some other way (e.g. counted, summed, etc.). For example, if your time series reports data once a minute, but you want the data values to be displayed every 30 minutes (and summarized by median over that time window), use align(30m, median, ts(my.metric)).
align() returns values at intervals that start at the beginning of epoch time (Jan 1, 1970).
For example, align(2d, ts(my.metric)) produces a value at every 48-hour interval starting with 1970-01-01T00:00:00Z.
align() returns each value at the beginning of the interval that contains the data values it summarizes.
For example, suppose align(1m, sum, ts(my.metric)) returns a value at 10:05:00pm. This returned value is the sum of the values reported by my.metric from 10:05:00pm to 10:05:59pm.
Metrics are automatically pre-aligned for performance reasons when more than 100 time series are used in an aggregation function. You might see a pre-align warning even if you’re not using the align() function. You can ignore the warning in most cases, for instance, if a metric reflects a parameter changing over time.
You can use any supported unit of time for the timeWindow parameter. The bw unit, which stands for bucket window, enforces the summarization option in the query instead of the chart. For example, align(1bw, [{mean|median|min|max|first|last|sum},] <tsExpression>) produces a chart that looks identical, regardless of summarization method that you choose in the chart.
Using bw can also improve query performance on larger time windows where you normally align to a smaller interval like 1 minute. For example, rawsum(align(1m, <tsExpression>)) can be optimized by using rawsum(align(1bw, <tsExpression>)).
Histogram Function
The align() histogram function adjusts the granularity of each histogram series described by the expression. Within each series, align() groups the histogram distributions into buckets of the specified duration, and then merges the distributions in each group to produce a single composite distribution for each bucket. For example, align(1h, hs(my.hsMetric.m)) merges groups of per-minute distributions to produce hourly distributions.
This function merges the centroids and counts to produce composite histogram distributions.
You typically use align() as part of an input hsExpression that you specify to another histogram query function, for example, max(align(10m, hs(users.settings.numberOfApiTokens.m)))
You can visualize align() by running it as a top-level query under a time-series chart. Doing so displays a time series that consists of just the median values from the distributions in each returned histogram series. The chart for align(hs(my.hsMetric.m)) is the same as the chart for median(align(hs(my.hsMetric.m))).
Examples
Time-series Function
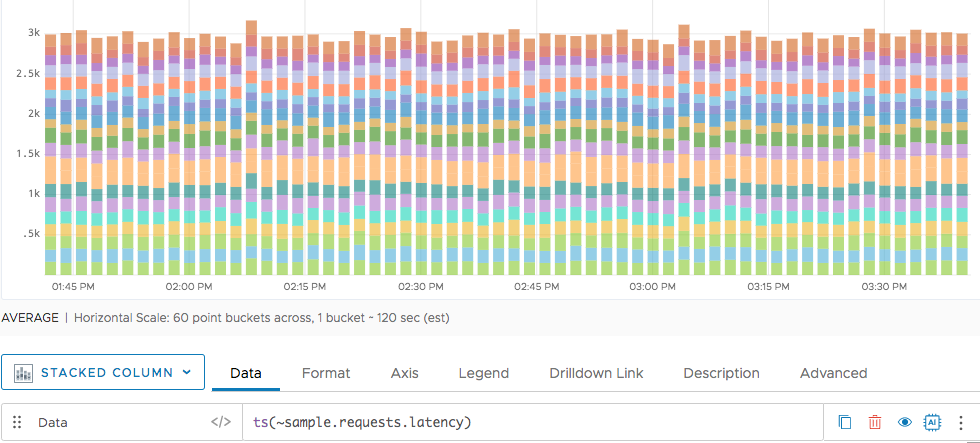
The following example shows a simple query for requests latency in a Stacked Column chart.
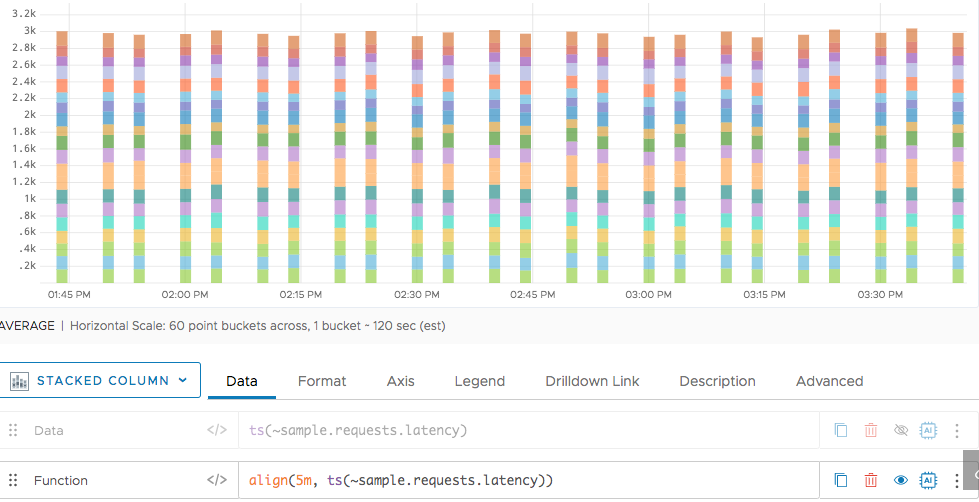
Next we put the results into 5 minute buckets.
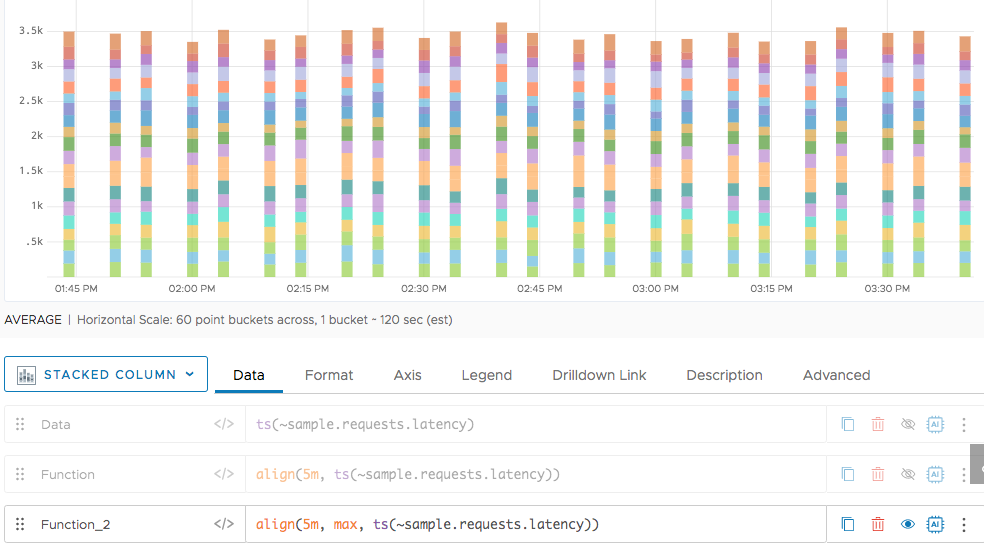
Finally, we use max as the alignment algorithm. The default for align() is median()
Histogram Function
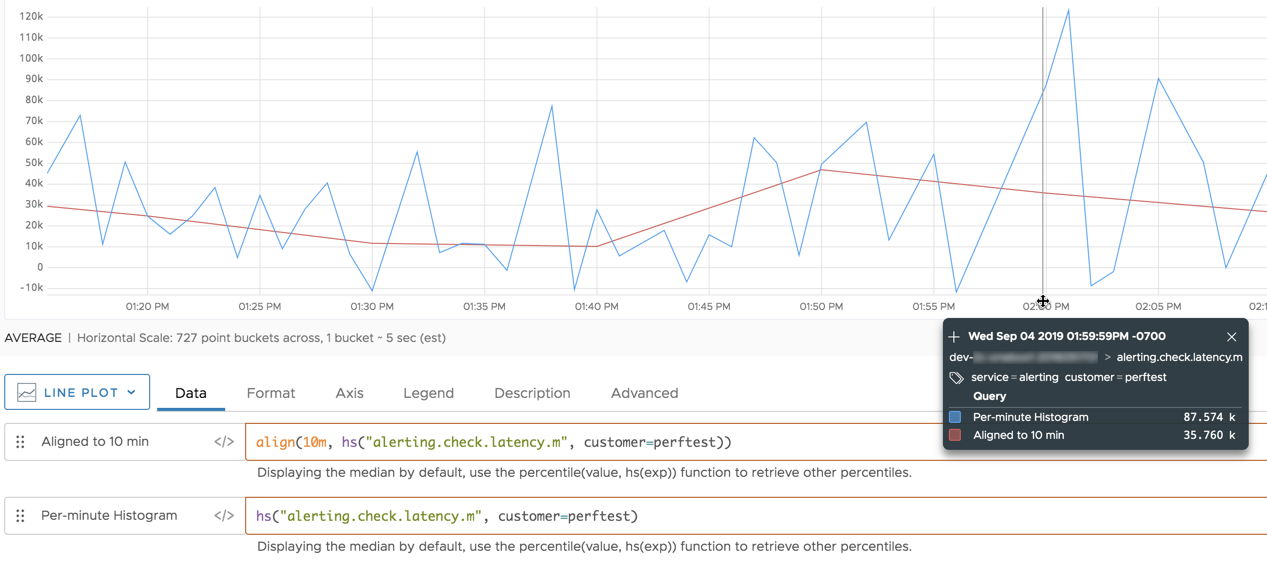
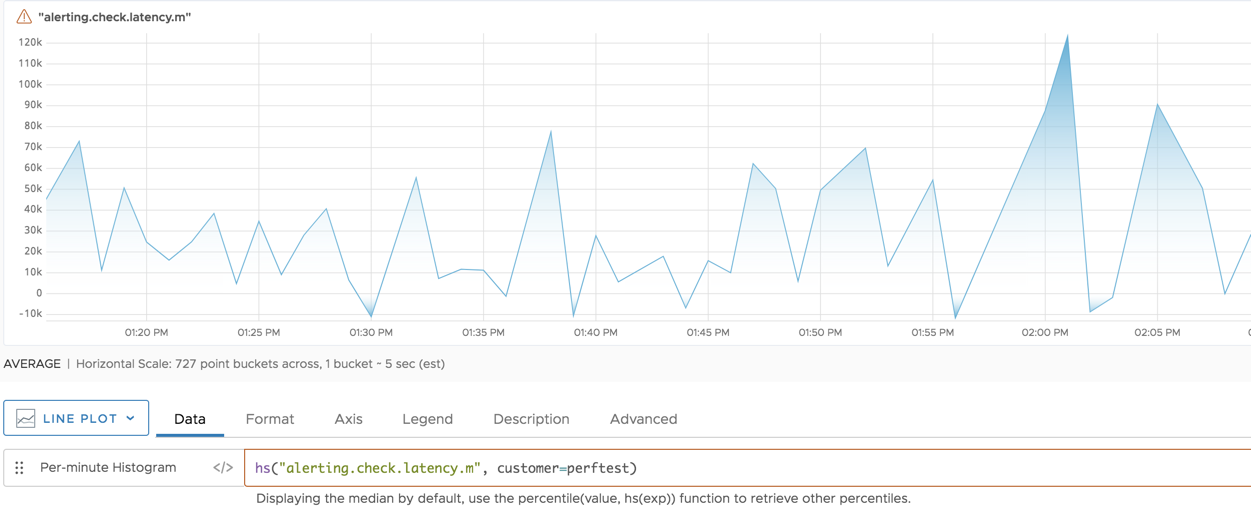
This chart represents the histogram series that is described by the expression hs(alerting.check.latency.m, customer="perftest"). The chart shows the histogram series as a line that consists of the median values of the distributions. The line contains one median value per minute.
Now we align the per-minute distributions into 10-minute buckets:
align(10m, hs(alerting.check.latency.m))
Aligning merges the histogram distributions “horizontally” to produce a less granular series of composite distributions. The chart displays the results as a single line that consists of the median values of the composite distributions. The line contains one median value every 10 minutes.