Summary
alignedSummary(<percentageList>, <hsExpression>)
Aligns the distributions of a histogram series into a single time bucket for the current chart (1vw), and then returns the significant values from the resulting composite distribution.
The summary includes a constant time series for each percentage percentile.
Parameters
| Parameter | Description |
|---|---|
| percentageList | Comma-separated list of percentages that specify the percentiles you want in your aligned summary.
A percentile is the value below which a given percentage of values fall in a histogram distribution. Specify:
|
| hsExpression | Expression describing the histogram series to align and summarize. |
Description
The alignedSummary() histogram function gives an overall picture of the histogram distributions in a chart’s time window. For each histogram series described by the expression, alignedSummary():
- Aligns the distributions across the current chart window to produce a single composite distribution.
- Summarizes the significant values from the composite distribution.
- Extends the summary across the chart as constant time series.
The following two queries are therefore equivalent:
alignedsummary(hs("my.metric.m))

last(summary(align(1vw, (hs("my.metric.m)))))
The aligned summary for a histogram series returns a constant time series for each requested percentile. A percentile is a value below which a particular percentage of values fall. For example, alignedSummary(75, 99.99, hs(my.hsMetric.m)) returns 2 constant time series: one for the value at the 75th percentile and one for the value at the 99.99th percentile from the composite distribution.
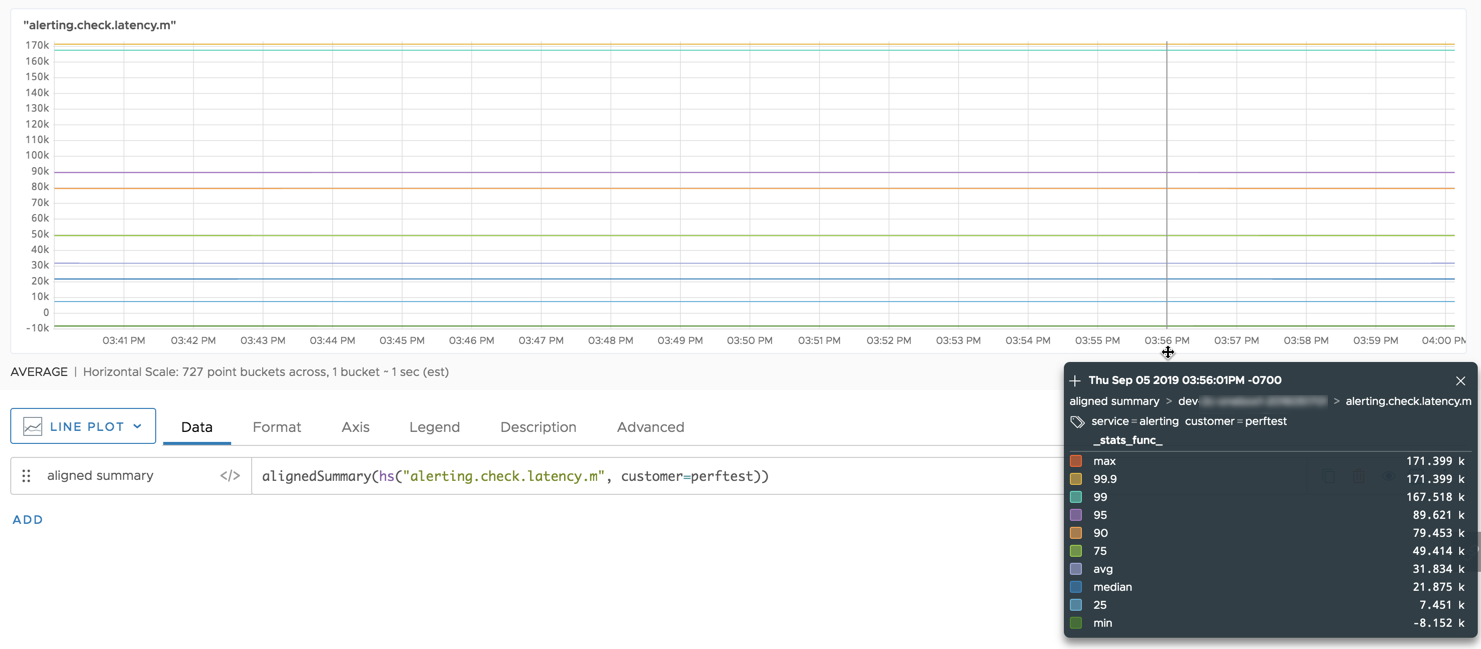
By default, alignedSummary() returns a constant time series for each the following: max, 99.9, 99, 95, 90, 75, avg, median (50), 25, and min.
Examples
Suppose you want to see the default percentiles for all the histogram distributions that fall between 3:40pm and 4:00pm. You adjust your chart to display that time window, and then run the query alignedSummary(hs("alerting.check.latency.m", customer=perftest)). The query returns 10 constant series, one for each of the default percentiles.