Summary
percentile(<percentage>, <tsExpression>[, metrics|sources|sourceTags|pointTags|<pointTagKey>])

percentile(<percentage>, <hsExpression>)
You can use percentile() with time series and with histograms.
| Time series aggregation function |
Returns the estimated percentage percentile across the set of time series described by tsExpression.
The results might be computed from real reported values and interpolated values.
Use rawpercentile() if you don’t want interpolation. |
| Histogram conversion function |
Returns time series that consist of the percentage percentiles from each histogram distribution described by the hsExpression. |
Parameters
Time-Series Aggregation Function
| Parameter | Description |
|---|---|
| percentage | A number greater than 0 and less than or equal to 100 that specifies the percentile of interest. You can include as many decimal places as you like. |
| tsExpression | Expression describing the set of time series to estimate the specified percentile for. |
| metrics|sources|sourceTags|pointTags|<pointTagKey> | Optional group by parameter for organizing the time series into subgroups and then estimating the specified percentile for each subgroup.
Use one or more parameters to group by metric names, source names, source tag names, point tag names, values for a particular point tag key, or any combination of these items. Specify point tag keys by name. |
Histogram Conversion Function
| Parameter | Description |
|---|---|
| percentage | A number from 0 to 100, inclusive, that specifies the percentile of interest. You can include as many decimal places as you like. |
| hsExpression | Expression describing the histogram series to obtain the specified percentiles from. |
Description
You can use percentile():
- With time series as an aggregation function.
- With histogram series as a conversion function.
Time-Series Aggregation Function
The percentile() aggregation function lets you estimate the specified percentile for the data values at each moment in time, across the time series that are represented by the expression.
A percentile is a value below which a particular percentage of data values fall. You specify the percentage as a positive real number that is less than or equal to 100. For example, if you specify a percentage of 99.4, percentile() returns a value at the 99.4th percentile for each successive moment in time. You can specify a percentage of 50 to obtain the median value across the time series. See Computing an Estimated Percentile for more details.
By default, percentile() returns a single series of percentile values across all time series. You can optionally group the time series based on one or more characteristics, and obtain a separate series of percentile values for each group.
If any time series has data gaps, percentile() fills them in by interpolation whenever possible.
Grouping
Like all aggregation functions, percentile() returns a single series of percentiles by default. You can include a group by parameter to return percentiles for separate groups of time series that share common metric names, source names, source tags, point tags, or values for a particular point tag key.
The function returns a separate series of results corresponding to each group.
You can specify multiple ‘group by’ parameters to group the time series based on multiple characteristics. For example, percentile(50, ts("cpu.cpu*"), metrics, Customer) first groups by metric names, and then groups by the values of the Customer point tag.
zone and ZONE, when you use an aggregation function and apply grouping, we consider zone and ZONE as separate tags. Interpolation
If any time series has gaps in its data, the query engine attempts to fill these gaps with interpolated values before applying the function. A value can be interpolated into a time series only if at least one other time series reports a real data value at the same moment in time.
Within a given time series, an interpolated value is calculated from two real reported values on either side of it. Sometimes interpolation is not possible–for example, when a new value has not been reported yet in a live-view chart. In this case, the query engine finds the last known reported value in the series, and assigns it to any subsequent moment in time for which a real reported data value is present in some other time series. We use the last known reported value only if interpolation can’t occur and if the last known reported value has been reported within the last 15% of the query time in the chart window.
You can use rawpercentile() to suppress interpolation. See Standard Versus Raw Aggregation Functions.
Computing an Estimated Percentile
A percentile is a value below which a particular percentage of data values fall. For example, in a given group of data values, the 75th percentile is a value that is greater than 75% of the data values in that group.
In general, percentiles can be estimated in various ways. The percentile() function computes the estimated percentile value for a given moment in time as follows:
- Obtain the set of reported and/or interpolated data values, one from each time series in the group.
- Sort these data values into an ordered list.
- Use the specified
percentageto compute the estimated percentile position in the list, and then:- If the estimated percentile position is a whole number, return the data value at that position.
- If the estimated percentile position is fractional, find the two data values on either side of it, and use them to interpolate the value to return.
- If the estimated percentile position falls before the list’s first position (or after the list’s last position), return the smallest (or largest) data value in the list.
The formula for computing the estimated percentile position pos is pos = percentage * (n+1)/100, where n is the number of data values.
Histogram Conversion Function
The percentile() histogram conversion function computes the specified percentile for the data values in each distribution of the histogram series that are represented by the expression. The percentiles for a given histogram series are returned as a separate time series that contains one data point corresponding to each input distribution.
A percentile is a value below which a particular percentage of data values fall. You specify the percentage as a real number that is less than or equal to 100. For example, if you specify a percentage of 99.4, percentile() returns a value at the 99.4th percentile from each successive distribution. You can specify a percentage of 50 to obtain the median value across the histogram series.
percentile() is a histogram conversion function because it takes histogram distributions as input, and returns time series. You can therefore use a histogram conversion function as a tsExpression parameter in a time series query function.
Examples
Time-Series Aggregation Function
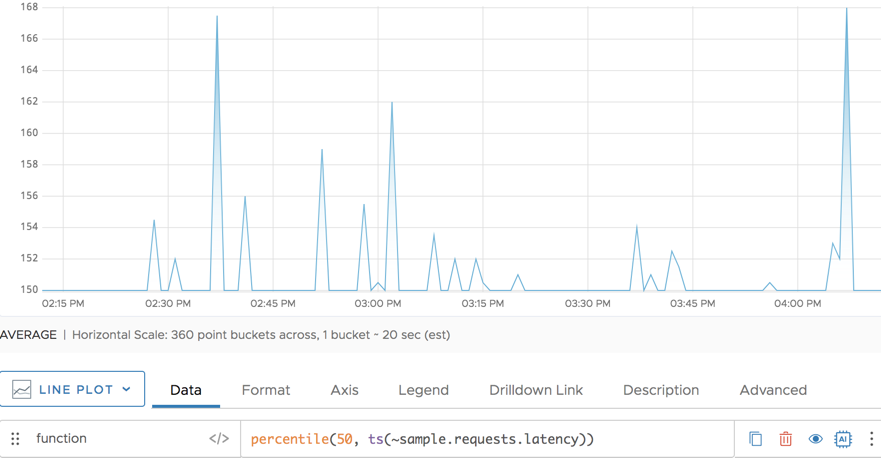
The following simple example shows the median (50th percentile) for the requests latency. It’s a single line because percentile() is an aggregation function.
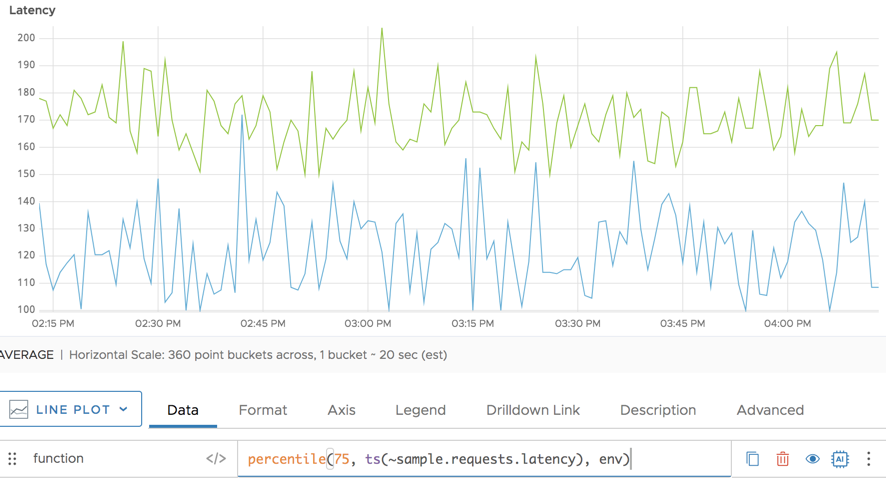
The following example shows the 75th percentile for the request latency. Here, we group by the env point tag and get a line for env=production and a line for env=dev.
Histogram Conversion Function
In the following example, the green line shows the result of using percentile() to compute the 75th percentile values from the distributions described by hsExpression.
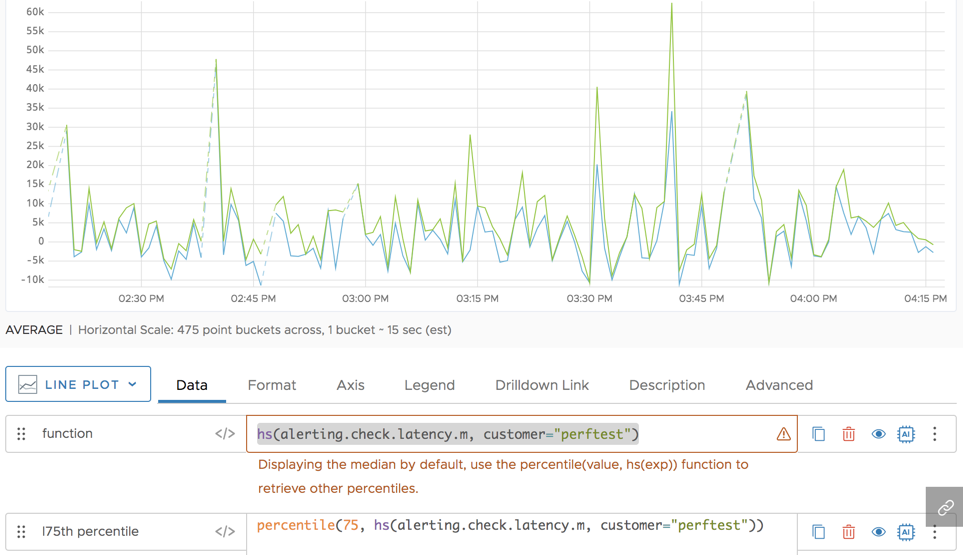
percentile() returns a separate time series for each input histogram series. In this example, the hsExpression represents a single histogram series, so the result is a single time series. (In contrast, when percentile() is applied to a tsExpression, a single returned time series might be the result of combining multiple input time series.)