Reference to the mpercentile() function
Summary
mpercentile(<timeWindow>, <percentage>, <tsExpression>)
Returns the value at the specified percentile for each time series over a moving time window.
Parameters
| Parameter | Description |
|---|---|
| timeWindow | Amount of time in the moving time window. You can specify a time measurement based on the clock or calendar (1s, 1m, 1h, 1d, 1w), the window length (1vw) of the chart, or the bucket size (1bw) of the chart. Default is minutes if the unit is not specified. |
| percentage | A number greater than 0 and less than or equal to 100 that specifies the percentile of interest. You can include as many decimal points as you like. |
| tsExpression | Expression describing the time series for which to return percentile values over the moving time window. |
Description
The mpercentile() function computes the value at the specified percentile for each time series over a shifting time window. For example, mpercentile(10m, 95, ts(my.metric)) returns, at each point, the data value at the 95th percentile among the values reported by a given time series during the previous 10 minutes.
The percentile value must be between 0 and 100.
Example
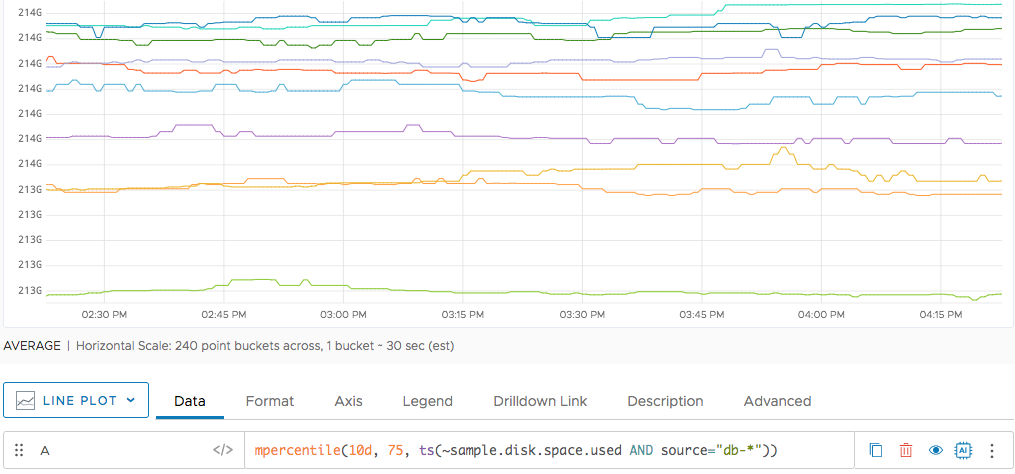
The following simple example shows 75th percentile value for disk space during the last 10 days. We’re showing an 8 day time window in this chart and are showing only sources that start with db-.
See Also
Detecting Anomalies With Functions and Statistical Functions