Summary
max(<tsExpression1>, <tsExpression2>)

max(<tsExpression>[, metrics|sources|sourceTags|pointTags|<pointTagKey>])

max(<hsExpression>)
You can use max() with time series and with histograms.
| Time series comparison function |
Returns the higher of the two values in tsExpression1 and tsExpression2. |
| Time series aggregation function |
Returns the highest value across the set of time series described by tsExpression. The results might be computed from real reported values and interpolated values. Use rawmax() if you don’t need interpolation. |
| Histogram conversion function |
Returns time series that consist of the highest value from each histogram distribution described by the hsExpression. |
Parameters
Time-Series Comparison Function
| Parameter | Description |
|---|---|
| tsExpression1 | Expression describing the time series to use as a threshold value for comparison. |
| tsExpression2 | Expression describing the time series to be compared against the threshold value. |
Time-Series Aggregation Function
| Parameter | Description |
|---|---|
| tsExpression | Expression describing the set of time series to return maximums for. |
| metrics|sources|sourceTags|pointTags|<pointTagKey> | Optional group by parameter for organizing the time series into subgroups and then returning the maximum for each subgroup.
Use one or more parameters to group by metric names, source names, source tag names, point tag names, values for a particular point tag key, or any combination of these items. Specify point tag keys by name. |
Histogram Conversion Function
| Parameter | Description |
|---|---|
| hsExpression | Expression describing the histogram series to obtain maximum values from. |
Description
You can use max():
- With time series as a comparison function or as an aggregation function.
- With histogram series as a conversion function.
Time-Series Comparison Function
The max() comparison function lets you display all data points above a desired threshold, and assigns the threshold value to all data points below the threshold.
Time-Series Aggregation Function
The max() aggregation function finds the highest (maximum) data value at each moment in time, across the time series that are represented by the expression.
By default, max() produces a single series of maximums by aggregating values across all time series. You can optionally group the time series based on one or more characteristics, and obtain a separate series of maximums for each group.
If any time series has data gaps, max() fills them in by interpolation whenever possible.
Grouping
The max() aggregation function returns a single series of results by default. You can include a group by parameter to obtain separate maximums for groups of time series that share common metric names, source names, source tags, point tags, or values for a particular point tag key.
The function returns a separate series of results corresponding to each group.
You can specify multiple ‘group by’ parameters to group the time series based on multiple characteristics. For example, max(ts("cpu.cpu*"), metrics, Customer) first groups by metric names, and then groups by the values of the Customer point tag.
zone and ZONE, when you use an aggregation function and apply grouping, we will consider zone and ZONE as separate tags. Interpolation
If any time series has gaps in its data, the query engine attempts to fill these gaps with interpolated values before applying the function. A value can be interpolated into a time series only if at least one other time series reports a real data value at the same moment in time.
Within a given time series, an interpolated value is calculated from two real reported values on either side of it. Sometimes interpolation is not possible–for example, when a new value has not been reported yet in a live-view chart. In this case, the query engine finds the last known reported value in the series, and assigns it to any subsequent moment in time for which a real reported data value is present in some other time series. We use the last known reported value only if interpolation can’t occur and if the last known reported value has been reported within the last 15% of the query time in the chart window.
You can use rawmax() to suppress interpolation. See Standard Versus Raw Aggregation Functions.
Histogram Conversion Function
The max() histogram conversion function returns the highest data value from each distribution of each histogram series that is represented by the expression. The maximum values for a given histogram series are returned as a separate time series that contains a data point corresponding to each input distribution.
max() is a histogram conversion function because it takes histogram distributions as input, and returns time series. You can therefore use a histogram conversion function as a tsExpression parameter in a time series query function.
Examples
Time-Series Comparison Function
The following example shows the total number of sample requests.
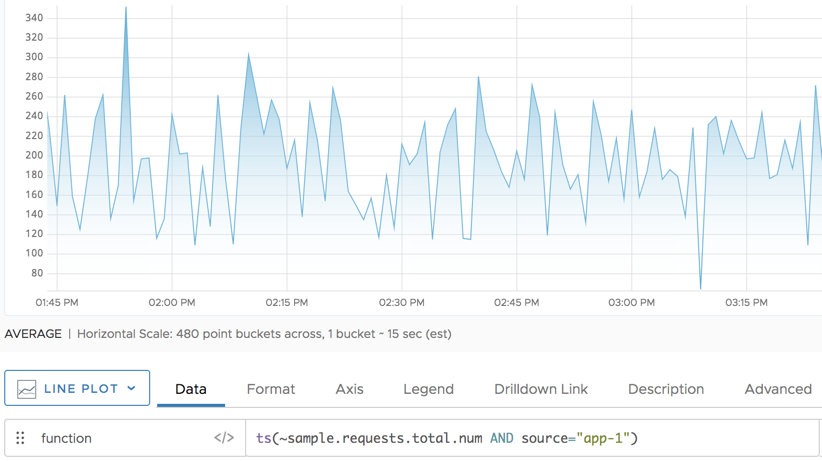
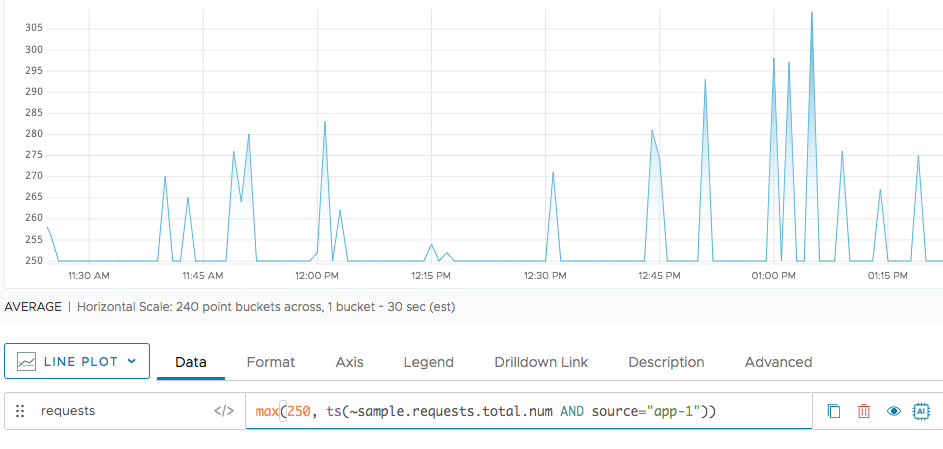
And here we see the only the metrics if there are more than 250 sample requests.
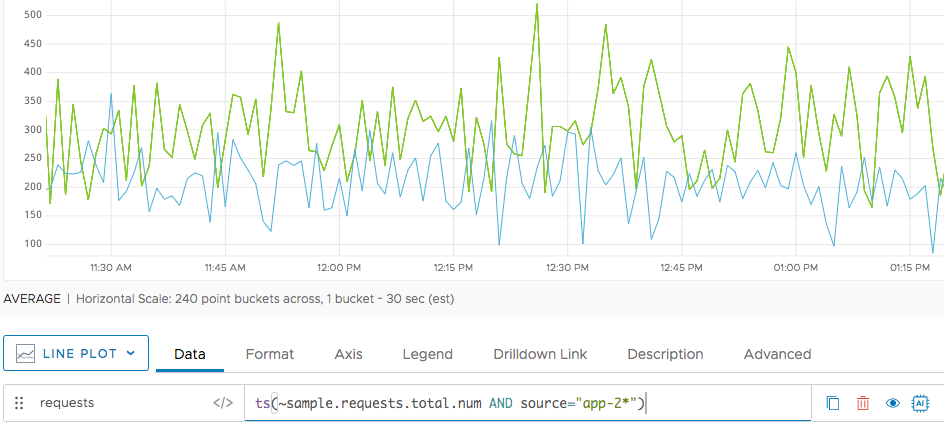
Time-Series Aggregation Function
The following example shows first the total number of sample requests for 2 sources, app-2 and app-20.
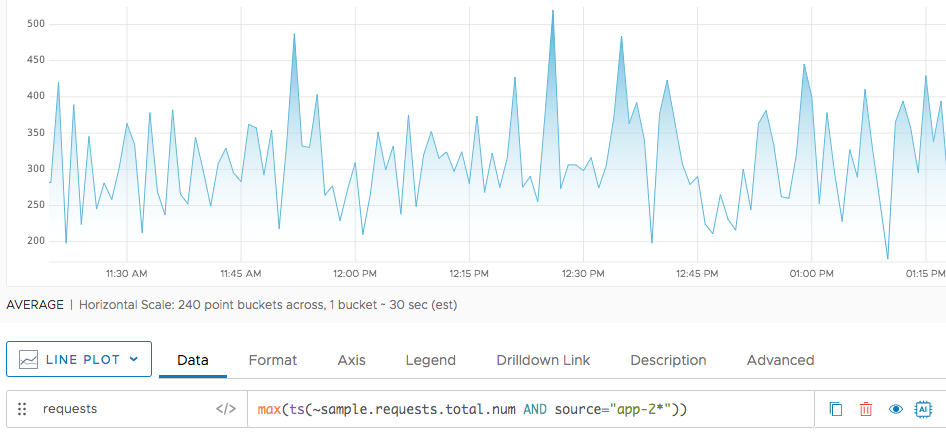
And here we see what happens when we apply max().
Histogram Conversion Function
In the following example, the blue line shows the result of applying max() to an hsExpression. (The red line is the median, shown for comparison.)
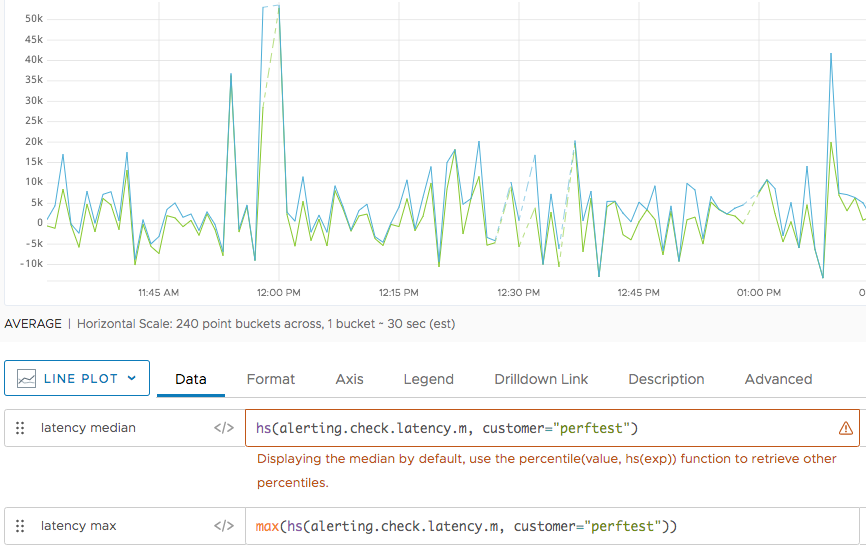
Note: max() returns a separate time series for each input histogram series. In this example, the hsExpression represents a single histogram series, so the result is a single time series. (In contrast, when max() is used as an aggregation function with a tsExpression, a single returned time series might be the result of combining multiple input time series.)
Caveats for Time Series
Sometimes it’s best to use max() with align().
See Bucketing with align().
Using rawmax() instead of max() can significantly improve query performance because rawmax() does not perform interpolation.