Summary
lag(<timeWindow>, <tsExpression>)
Returns earlier data values from the time series described by the expression, to help you compare each time series with its own past behavior.
Parameters
| Parameter | Description |
|---|---|
| timeWindow | Amount of time you want to go back to obtain the past values. You can specify a time measurement based on the clock or calendar (1s, 1m, 1h, 1d, 1w), the window length (1vw) of the chart, or the bucket size (1bw) of the chart. Default is minutes if the unit is not specified. |
| tsExpression | Expression describing the time series to return earlier values from. |
Description
The lag() standard time function returns data values that were reported earlier by the time series described by the expression. The data values are time-shifted forward by the specified amount of time along the time axis, for easy comparison with more recent data values.
For example, say you want to use a single chart to show a set of recent data values reported by a time series, along with the data values that were reported 4 hours earlier. You can use lag() to “time-shift” the time series by 4 hours, so that the earlier values align, point for point, with the more recent values.
lag() returns a separate series of results for each time series described by the expression.
Note:
- If you simply want to see earlier values without comparing them to more recent data in the same chart, you can simply click Custom Date and specify the start and end time to display.
- If you want to time shift by 1 day, 1 week, or 1 month, you can use the chart’s Compare menu as a shortcut for querying with
lag(1d, ...),lag(1w, ...), orlag(1m, ...).
This function is also well suited for highlighting trends.
Examples
Compare with Earlier Values
Here’s a query that shows some recent request latency averages.
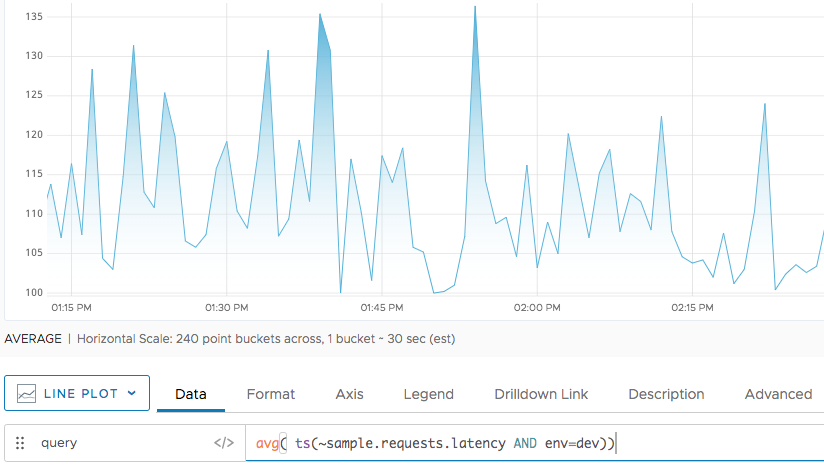
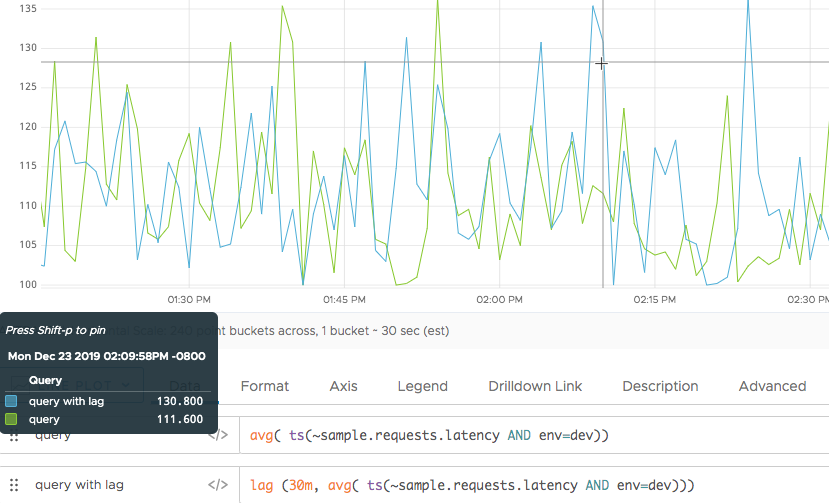
Now we’d like to see how these averages compare to the averages that were reported 30 minutes earlier. We add a second query that applies lag() to the original query. At a given moment in time, lag() returns the value that was actually reported by the time series 30 minutes earlier.
Show Trend
You can also use lag() to show a trend. Assume you start with CPU information, as in the following chart:
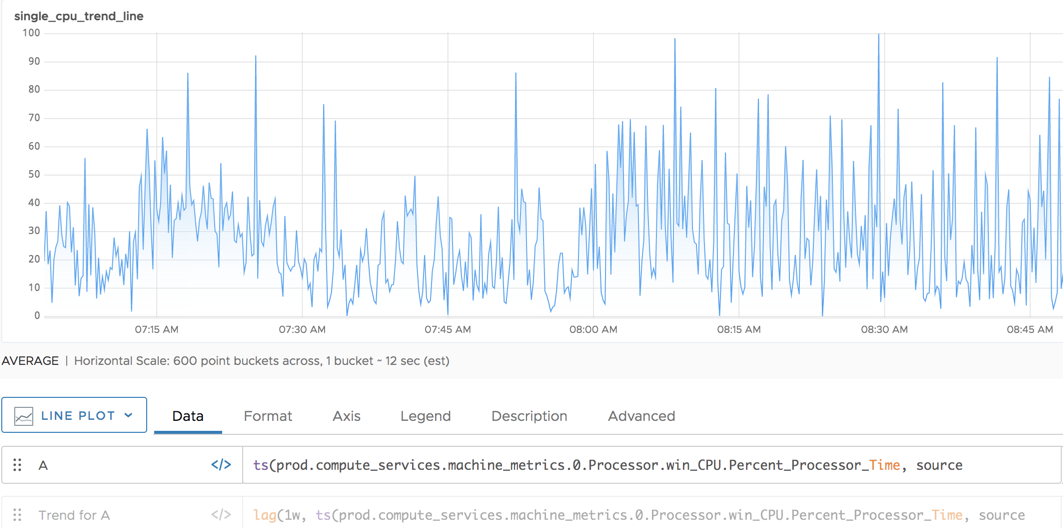
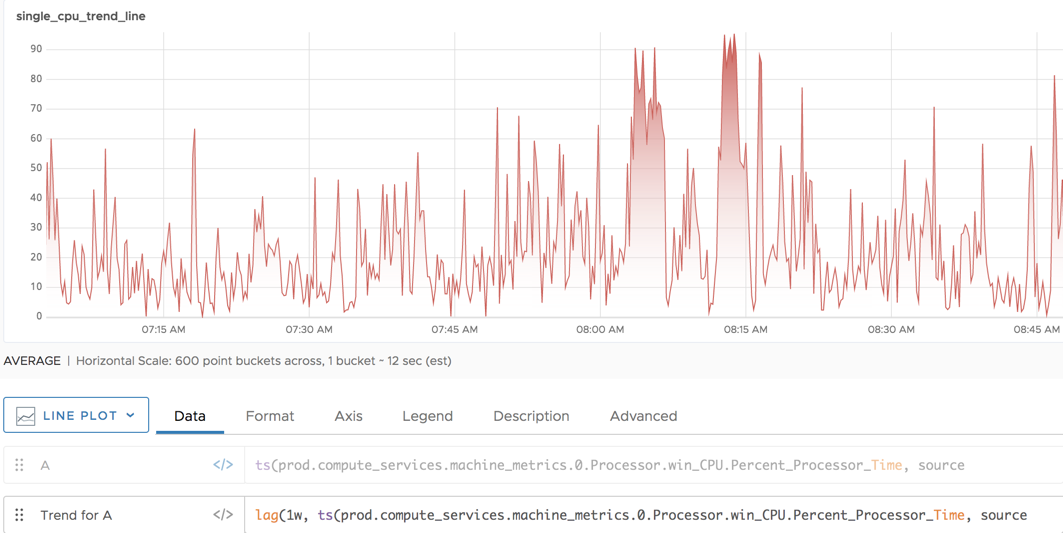
When you wrap lag() around that function, you’re showing the trend for the CPU information.
Caveats
lag() to a histogram. Even if you convert the histogram to a tsExpression, an error results if you then apply lag().