Learn about the Fluentd Integration.
This page provides an overview of what you can do with the Fluentd integration. The documentation pages only for a limited number of integrations contain the setup steps and instructions. If you do not see the setup steps here, navigate to the Operations for Applications GUI. The detailed instructions for setting up and configuring all integrations, including the Fluentd integration are on the Setup tab of the integration.
- Log in to your Operations for Applications instance.
- Click Integrations on the toolbar, search for and click the Fluentd tile.
- Click the Setup tab and you will see the most recent and up-to-date instructions.
Fluentd Integration
Fluentd is an open source data collector for a unified logging layer. By setting up this integration, you can send Fluentd metrics into Operations for Applications.
- Fluentd: This integration installs and configures Telegraf to send Fluentd metrics into Operations for Applications. Telegraf is a light-weight server process capable of collecting, processing, aggregating, and sending metrics to a Wavefront Proxy.
- Fluentd on Kubernetes: This explains the configuration of Kubernetes Metrics Collector to scrape Fluentd metrics using auto-discovery and annotation based discovery.
In addition to setting up the metrics flow, this integration also installs dashboards:
- Fluentd
- Fluentd on Kubernetes
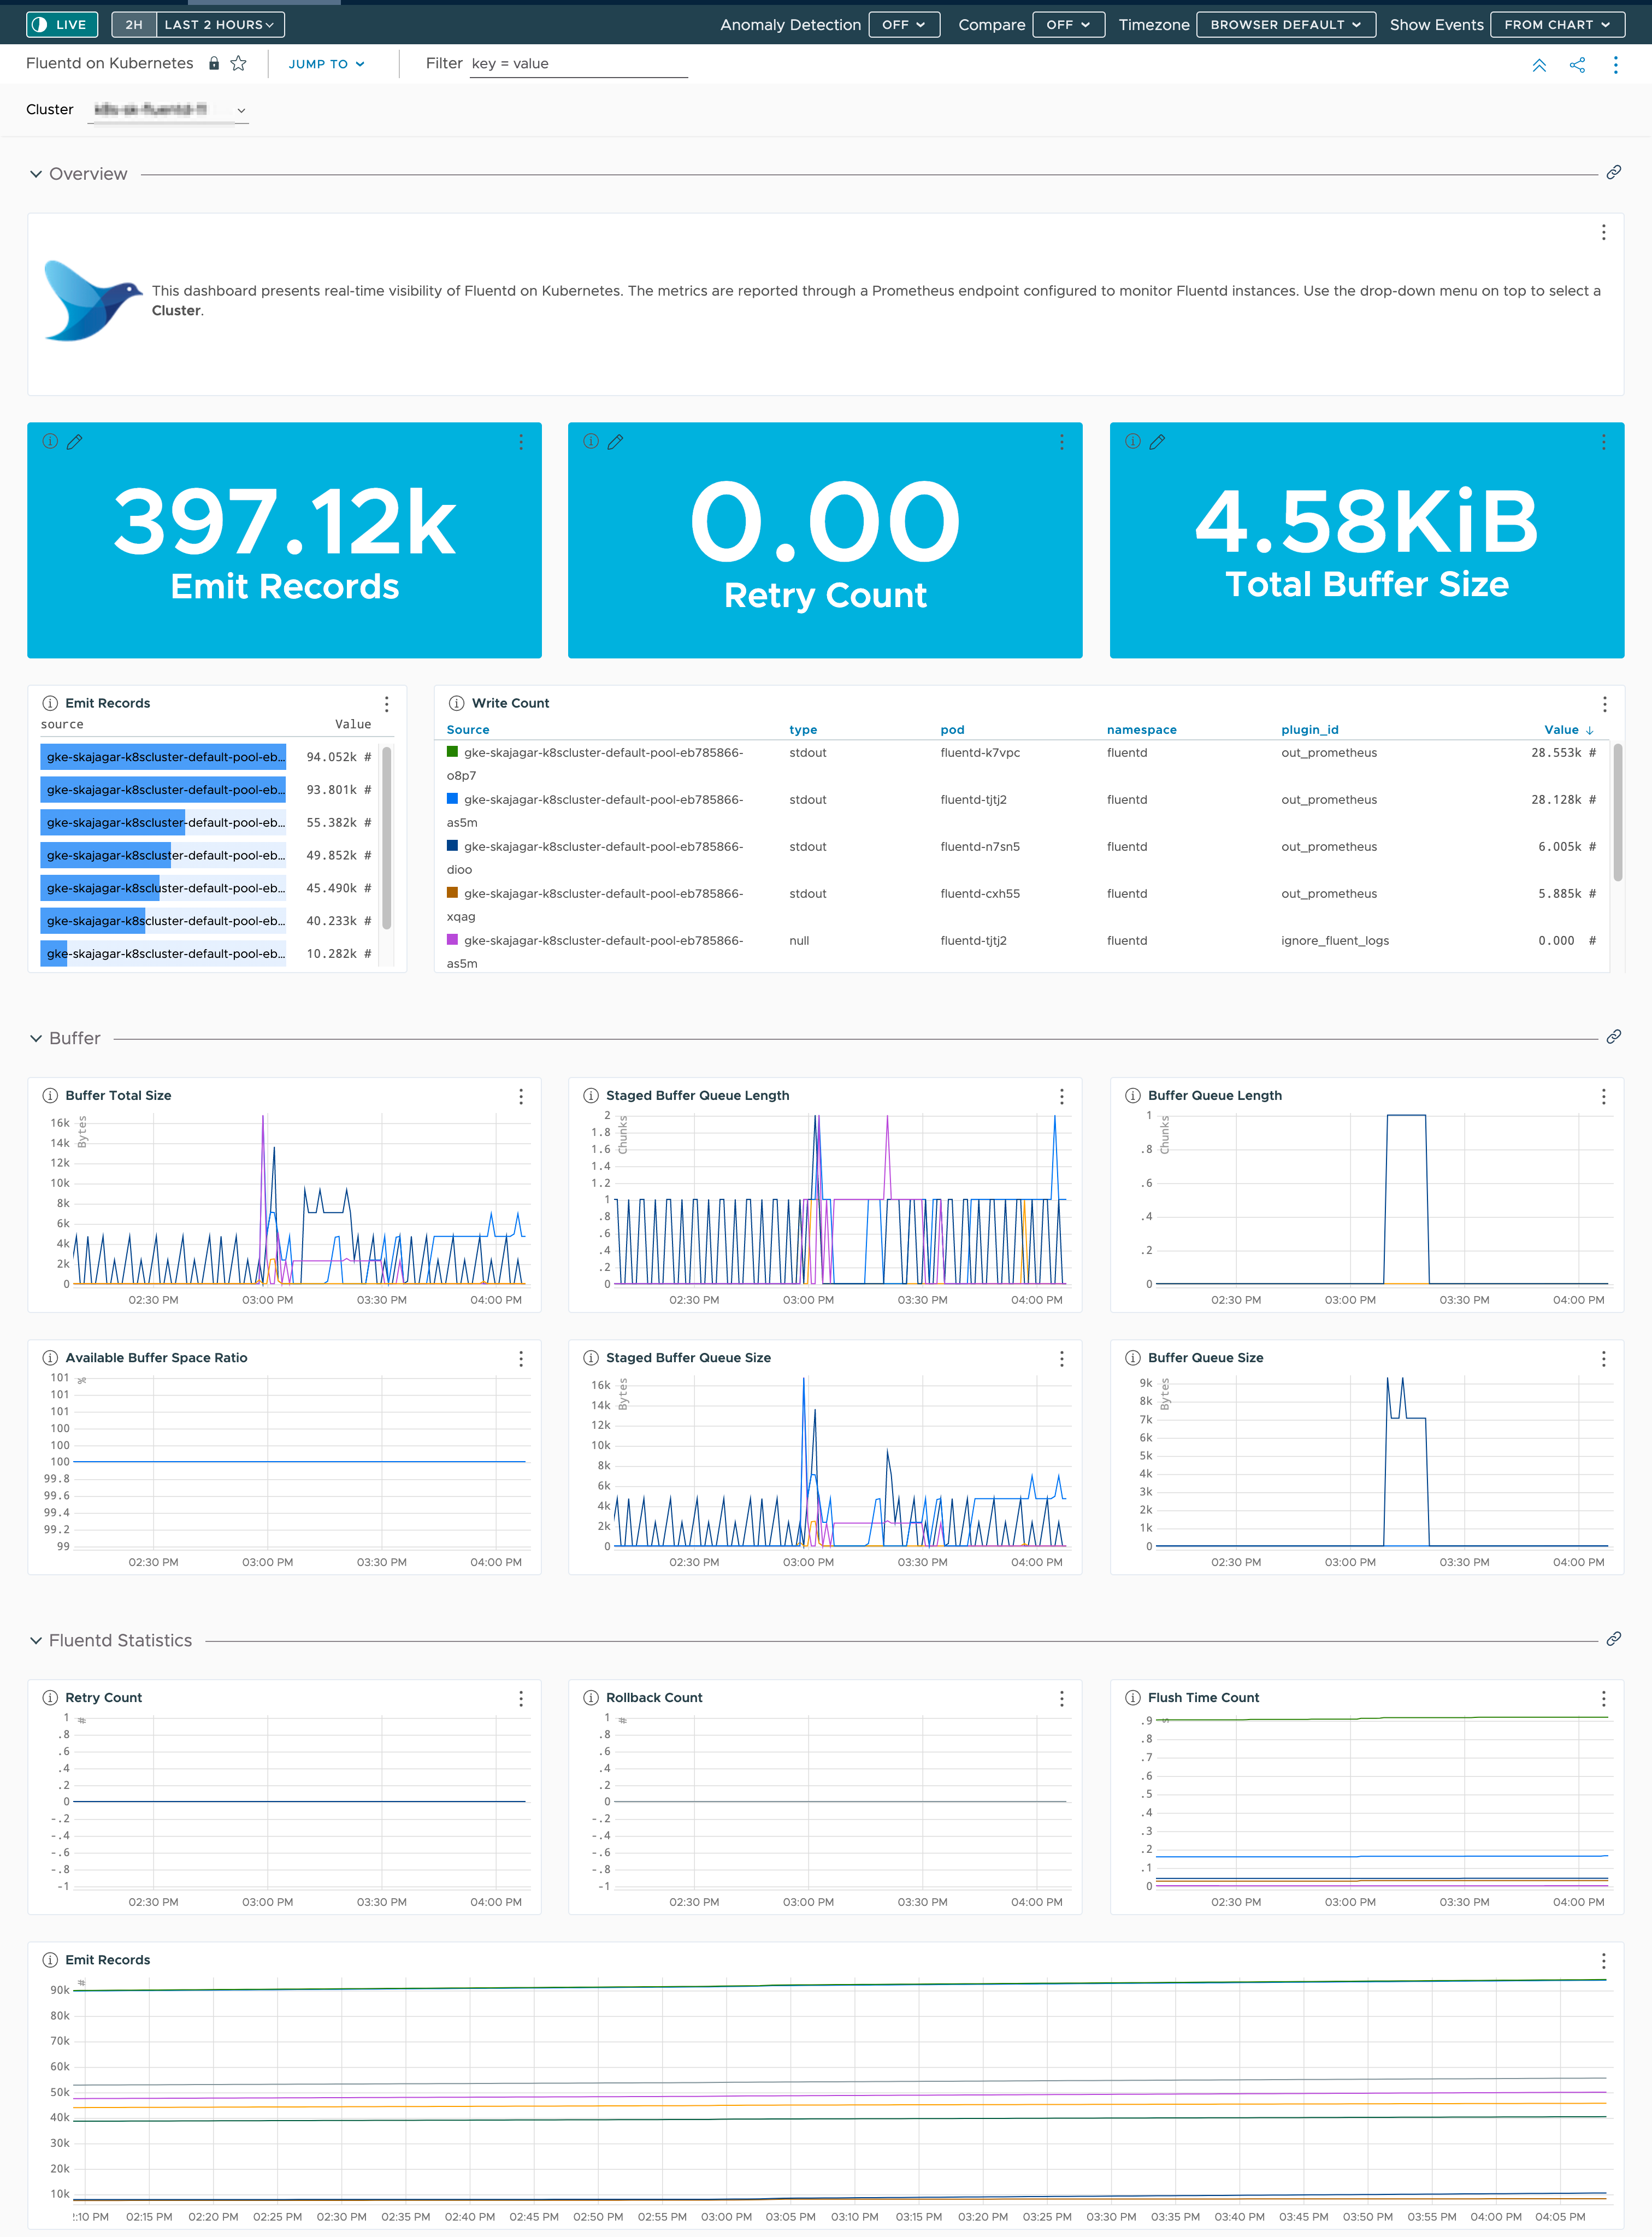
Here’s a section of a dashboard displaying Fluentd metrics:
Fluentd
| Metric Name | Description |
|---|---|
| fluentd.retry.count | The number of retry attempts. |
| fluentd.buffer.queue.length | The length of the buffer queue. |
| fluentd.buffer.total.queued.size | The size of the buffer queue. |
| fluentd.emit.records | The number of emit records. |
| fluentd.emit.count | The total number of emit call. |
| fluentd.emit.size | The total size of emit events. |
| fluentd.write.count | The total number of write/try_write call. |
| fluentd.rollback.count | The total number of rollback. Rollback happens when write/try_write failed. |
| fluentd.slow.flush.count | The total number of slow flush. This count will be incremented when buffer flush is longer than slow_flush_log_threshold. |
| fluentd.flush.time.count | The total time of buffer flush in milliseconds. |
| fluentd.buffer.stage.length | The length of staged buffer chunks. |
| fluentd.buffer.stage.byte.size | The current bytesize of staged buffer chunks. |
| fluentd.buffer.queue.byte.size | The current bytesize of queued buffer chunks. |
| fluentd.buffer.available.buffer.space.ratios | Show available space for buffer. |
Fluentd on Kubernetes
| Metric Name | Description |
|---|---|
| fluentd.output.status.retry.count.gauge | The number of retry attempts. |
| fluentd.output.status.buffer.queue.length.gauge | The length of the buffer queue. |
| fluentd.output.status.buffer.total.bytes.gauge | The size of the buffer queue. |
| fluentd.output.status.emit.records.gauge | The number of emit records. |
| fluentd.output.status.emit.count.gauge | The total number of emit call. |
| fluentd.output.status.write.count | The total number of write/try_write call. |
| fluentd.output.status.rollback.count.gauge | The total number of rollback. Rollback happens when write/try_write failed. |
| fluentd.output.status.retry.wait.gauge | If write out fails, Fluentd will retry after waiting for retry_wait seconds |
| fluentd.output.status.slow.flush.count.gauge | The total number of slow flush. This count will be incremented when buffer flush is longer than slow_flush_log_threshold. |
| fluentd.output.status.flush.time.count.gauge | The total time of buffer flush in milliseconds. |
| fluentd.output.status.buffer.stage.length.gauge | The length of staged buffer chunks. |
| fluentd.output.status.buffer.stage.byte.size.gauge | The current bytesize of staged buffer chunks. |
| fluentd.output.status.queue.bytesize.gauge | The current bytesize of queued buffer chunks. |
| fluentd.output.status.buffer.available.space.ratio.gauge | Show available space for buffer. |