This page provides an overview of what you can do with the .NET integration. The documentation pages only for a limited number of integrations contain the setup steps and instructions. If you do not see the setup steps here, navigate to the Operations for Applications GUI. The detailed instructions for setting up and configuring all integrations, including the .NET integration are on the Setup tab of the integration.
- Log in to your Operations for Applications instance.
- Click Integrations on the toolbar, search for and click the .NET tile.
- Click the Setup tab and you will see the most recent and up-to-date instructions.
.NET Integration
The .NET Framework provides tools for building networked applications, distributed web services and web applications. This integration installs and configures Telegraf to send .NET performance metrics into Wavefront. Telegraf is a light-weight server process capable of collecting, processing, aggregating, and sending metrics to a Wavefront proxy.
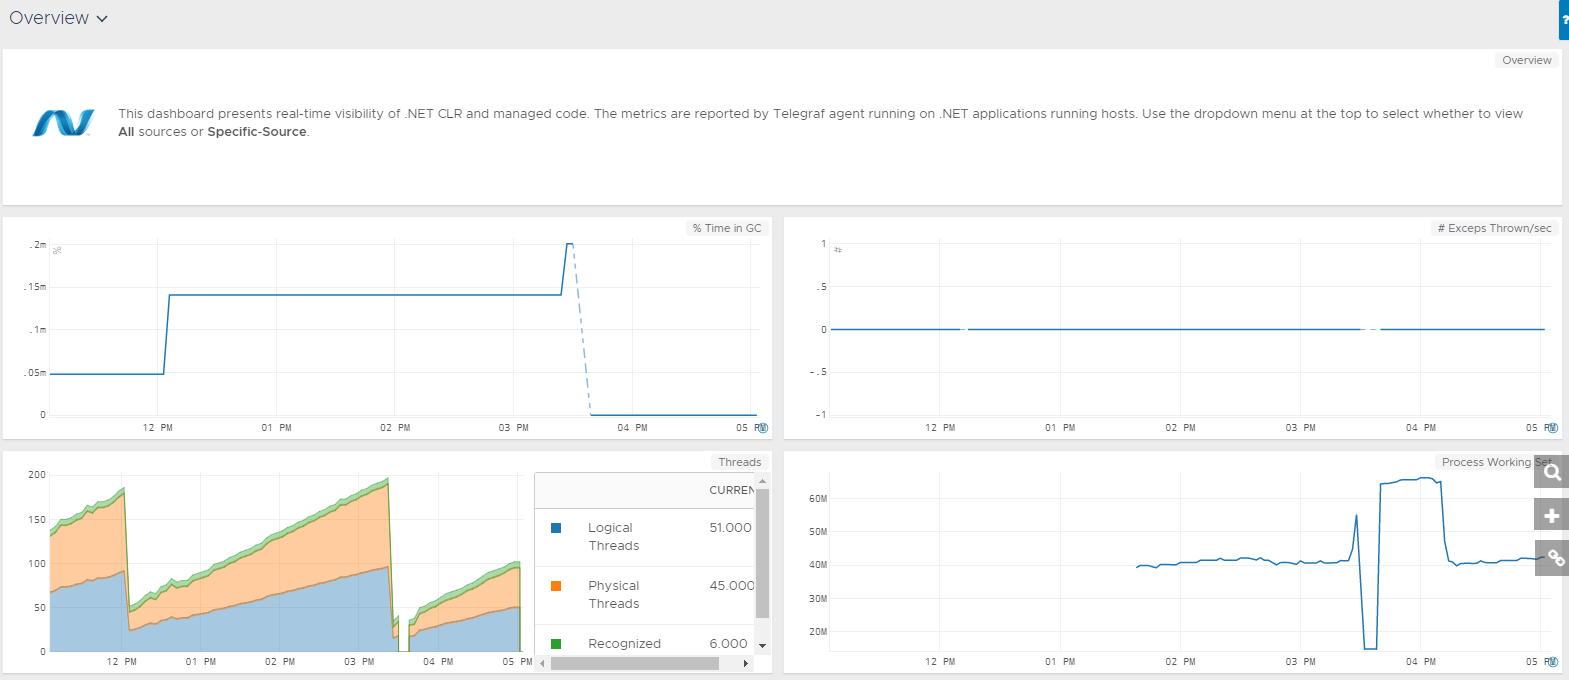
In addition to setting up the metrics flow, this integration also installs a dashboard. Here’s the Overview section of a dashboard displaying .NET metrics:
Metrics
This information is summarized from https://docs.microsoft.com/en-us/dotnet/framework/debug-trace-profile/performance-counters. See that Microsoft page for details.
| Metric Name | Description |
|---|---|
| dotnet.exceptions.-.of.Exceps.Thrown | Total number of exceptions thrown since the application started. |
| dotnet.exceptions.-.of.Exceps.Thrown.-.Sec | Number of exceptions thrown per second. |
| dotnet.exceptions.-.of.Filters.-.Sec | Number of .NET exception filters executed per second. |
| dotnet.exceptions.-.of.Finallys.-.Sec | number of finally blocks executed per second. (A finally block is guaranteed to be executed regardless of how the try block was exited). |
| dotnet.exceptions.Throw.to.Catch.Depth.-.Sec | Number of stack frames traversed, from the frame that threw the exception to the frame that handled the exception, per second |
| dotnet.interop.-.of.CCWs | Current number of COM callable wrappers (CCWs). |
| dotnet.interop.-.of.Stubs | Current number of stubs created by the common language runtime. |
| dotnet.interop.-.of.TLB.exports.-.sec | (Reserved for future use) |
| dotnet.interop.-.of.TLB.imports.-.sec | (Reserved for future use) |
| dotnet.jit.-.of.IL.Bytes.JITted | Total number of Microsoft intermediate language (MSIL) bytes compiled by the just-in-time (JIT) compiler since the application started. |
| dotnet.jit.-.of.Methods.JITted | Total number of methods JIT-compiled since the application started. This counter does not include pre-JIT-compiled methods. |
| dotnet.jit.IL.Bytes.Jitted.-.sec | Number of MSIL bytes that are JIT-compiled per second. |
| dotnet.jit.Percent.Time.in.Jit | Percentage of elapsed time spent in JIT compilation since the last JIT compilation phase. |
| dotnet.jit.Standard.Jit.Failures | Peak number of methods the JIT compiler has failed to compile since the application started. |
| dotnet.jit.Total.-.of.IL.Bytes.Jitted | Total MSIL bytes JIT-compiled since the application started. |
| dotnet.loading.Assembly.Search.Length | Reserved for future use. |
| dotnet.loading.Bytes.in.Loader.Heap | Current size, in bytes, of the memory committed by the class loader across all application domains. Committed memory is the physical space reserved in the disk paging file. |
| dotnet.loading.Current.Assemblies | Current number of assemblies loaded across all application domains in the currently running application. |
| dotnet.loading.Current.Classes.Loaded | Current number of classes loaded in all assemblies. |
| dotnet.loading.Current.appdomains | Current number of application domains loaded in this application. |
| dotnet.loading.Percent.Time.Loading | Reserved for future use. |
| dotnet.loading.Rate.of.Assemblies | Number of assemblies loaded per second across all application domains. |
| dotnet.loading.Rate.of.Classes.Loaded | Number of classes loaded per second in all assemblies. This counter is not an average over time; it displays the difference between the values observed in the last two samples divided by the duration of the sample interval. |
| dotnet.loading.Rate.of.appdomains | Number of application domains loaded per second. This counter is not an average over time; it displays the difference between the values observed in the last two samples divided by the duration of the sample interval. |
| dotnet.loading.Rate.of.appdomains.unloaded | Number of application domains unloaded per second. |
| dotnet.loading.Total.-.of.Load.Failures | Number of classes that failed to load per second. |
| dotnet.loading.Total.Appdomains | Peak number of application domains loaded since the application started. |
| dotnet.loading.Total.Assemblies | Total number of assemblies loaded since the application started. |
| dotnet.loading.Total.Classes.Loaded | Cumulative number of classes loaded in all assemblies since the application started. |
| dotnet.loading.Total.appdomains.unloaded | Total number of application domains unloaded since the application started. |
| dotnet.locks.-.of.current.logical.Threads | Number of current managed thread objects in the application. |
| dotnet.locks.-.of.current.physical.Threads | Number of native operating system threads created and owned by the common language runtime to act as underlying threads for managed thread objects. |
| dotnet.locks.-.of.current.recognized.threads | Number of threads that are currently recognized by the runtime. |
| dotnet.locks.-.of.total.recognized.threads | Total number of threads that have been recognized by the runtime since the application started. |
| dotnet.locks.Contention.Rate.-.Sec | Rate at which threads in the runtime attempt to acquire a managed lock unsuccessfully. |
| dotnet.locks.Current.Queue.Length | Total number of threads that are currently waiting to acquire a managed lock in the application. |
| dotnet.locks.Queue.Length.-.sec | Number of threads per second that are waiting to acquire a lock in the application. |
| dotnet.locks.Queue.Length.Peak | Total number of threads that waited to acquire a managed lock since the application started. |
| dotnet.locks.Total.-.of.Contentions | Total number of times that threads in the runtime have attempted to acquire a managed lock unsuccessfully. |
| dotnet.locks.rate.of.recognized.threads.-.sec | Number of threads per second that have been recognized by the runtime. |
| dotnet.mem.-.Bytes.in.all.Heaps | Current memory allocated in bytes on the garbage collection heaps. |
| dotnet.mem.-.GC.Handles | Current number of garbage collection handles in use. |
| dotnet.mem.-.Gen.0.Collections | Number of times the generation 0 objects (that is, the youngest, most recently allocated objects) are garbage collected since the application started. |
| dotnet.mem.-.Gen.1.Collections | Number of times the generation 1 objects are garbage collected since the application started. |
| dotnet.mem.-.Gen.2.Collections | Number of times the generation 2 objects are garbage collected since the application started. |
| dotnet.mem.-.Induced.GC | Peak number of times garbage collection was performed because of an explicit call to GC.Collect. |
| dotnet.mem.-.Total.committed.Bytes | Number of pinned objects encountered in the last garbage collection. |
| dotnet.mem.-.Total.reserved.Bytes | Amount of virtual memory, in bytes, currently reserved by the garbage collector. |
| dotnet.mem.-.of.Pinned.Objects | Number of pinned objects encountered in the last garbage collection. |
| dotnet.mem.-.of.Sink.Blocks.in.use | Current number of synchronization blocks in use. |
| dotnet.mem.Allocated.Bytes.persec | Number of bytes per second allocated on the garbage collection heap. |
| dotnet.mem.Finalization.Survivors | Number of garbage-collected objects that survive a collection because they are waiting to be finalized. |
| dotnet.mem.Gen.0.Promoted.Bytes.persec | Bytes per second that are promoted from generation 0 to generation 1. |
| dotnet.mem.Gen.0.heap.size | Maximum bytes that can be allocated in generation. |
| dotnet.mem.Gen.1.Promoted.Bytes.persec | Bytes per second that are promoted from generation 1 to generation 2. |
| dotnet.mem.Gen.1.heap.size | Current number of bytes in generation 1; this counter does not display the maximum size of generation 1. |
| dotnet.mem.Gen.2.heap.size | Current number of bytes in generation 2. |
| dotnet.mem.Large.Object.Heap.size | Current size, in bytes, of the large object heap. |
| dotnet.mem.Percent.Time.in.GC | Percentage of elapsed time that was spent performing a garbage collection since the last garbage collection cycle. |
| dotnet.mem.Process.ID | Process ID of the CLR process instance that is being monitored. |
| dotnet.mem.Promoted.Finalization-Memory.from.Gen.0 | Bytes of memory that are promoted from generation 0 to generation 1 only because they are waiting to be finalized. |
| dotnet.mem.Promoted.Memory.from.Gen.* | Bytes of memory that survive garbage collection and are promoted from generation X to generation Y. |
| dotnet.mem.Promoted.Memory.from.Gen.0 | Bytes of memory that survive garbage collection and are promoted from generation 0 to generation 1. |
| dotnet.security.-.Link.Time.Checks | Total number of link-time code access security checks since the application started. |
| dotnet.security.Percent.Time.in.RT.checks | Percentage of elapsed time spent performing runtime code access security checks since the last sample. |
| dotnet.security.Stack.Walk.Depth | Depth of the stack during that last runtime code access security check. |
| dotnet.security.Total.Runtime.Checks | Total number of runtime code access security checks performed since the application started. |
| dotnet.thread.Context.Switches.persec | Thread context switches per second. |
| dotnet.thread.Percent.Privileged.Time | Percentage of time that a thread runs in privileged mode. |
| dotnet.thread.Percent.Processor.Time | Percentage of time that a thread runs in processor mode. |
| dotnet.thread.Percent.User.Time | Percentage of time that a thread runs in user mode. |
| dotnet.thread.Priority.Base | Scheduling priority of a thread. |
| dotnet.thread.Priority.Current | Current thread scheduling priority. |
| dotnet.thread.Thread.State | Thread state. |