These release notes give an overview of the changes for the 2021-26.x to 2021-35.x releases of the VMware Aria Operations for Applications (previously known as Tanzu Observability by Wavefront) service.
2021-35.x Release Notes
- Sampling Policies: If you can’t find traces in Wavefront because Intelligent Sampling discarded them, you can now create a sampling policy. Sampling policies let Wavefront know that you want to keep specific traces. See Managing Sampling Policies for details.
Note: Sampling policies impact the volume of data ingested by Wavefront and can affect your costs. See Track the Volume of Trace Data Stored in Wavefront for details on the number of spans you store in Wavefront with the sampling policies.
- OpenTelemetry: Reorganized the distributed tracing documentation to include OpenTelemetry.
Important: OpenTelemetry is still at its early stage. Therefore, if you run into issues when configuring Wavefront with OpenTelemetry, contact Wavefront Technical Support for help.
2021-34.x Release Notes
-
UI performance improvements: We’ve done extensive revamp of the rendering code for dashboards and charts. Measurements show improvements on all dashboards, some up to 50% faster. Improvements will be especially noticeable in dashboards with many line charts or point plots.
See Ensure Optimal Dashboard Performance for suggestions on how you can improve performance even more.
Note: This feature is rolled out to customers incrementally in the next few weeks
2021-33.x Release Notes
- Maintenance Mode Improvements:
- You can specify point tags when filtering alerts that you want to set to maintenance mode.
- You can specify alternate targets to notify during a maintenance mode.
2021-28.x Release Notes
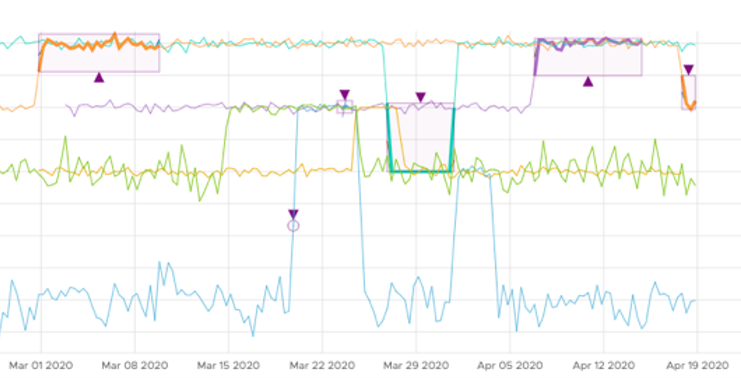
- Anomaly Detection on Charts: With this release, we deprecate the support of AI Genie and replace it with the new Anomaly Detection feature, which is available for Line Plot chats.
Note: This feature is rolled out to customers incrementally in the next few weeks
You can:
- Turn anomaly detection on and off.
- Explore all anomalies, which are highlighted in a different manner depending on their size.
- Select a specific anomaly.
- Create alerts by using the
anomalous ()function, but note, that you must do that with caution, because queries with theanomalous()function are resource intensive.
For example, in the line plot below you can see large and small anomalies. Large anomalies are highlighted with square purple borders and small anomalies are highlighted with cycle purple borders.
- Delete Alert Target Improvements: Previously, alert targets could not be deleted if alert target was in used by an alert. Users can now click Delete Notificant to delete the alert target even if it is in use by alerts. That action removes the target from any alerts.
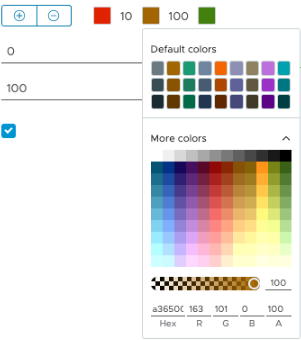
- Accessibility Improvements: Additional improvements to color selector options on different product pages.
2021-27.x Release Notes
- PromQL Compatibility Improvements: Miscellaneous improvements. For example, the
percentile(),mpercentile()andvariance()functions now work as expected. - New Doc Page: Monitor Tanzu Mission Control with Wavefront
2021-26.x Release Notes
-
Accessibility Improvements:
In addition to the already existing keyboard navigation for some of the Wavefront UI pages, now we have support for end-to-end keyboard navigation for the following UI pages:
- Create a dashboard wizard
- Chart page
- Integrations list page
- Kubernetes integration page
- Sources Browser pages
- Maintenance Windows page
- User profile page
- Metrics Browser page
We have also improved drag-and-drop keyboard navigation when you create or edit charts, or when you create or edit a metrics security policy. To use the drag-and-drop navigation:
- To enter drag mode, press spacebar.
- Use the arrow keys to move the item, for example a query line.
- Press spacebar to drop the item in its new position.
You can rearrange:
- Query lines
- Functions within a query line in Query Builder
- Variables
- List values when you add variables to a dashboard
- Metrics Security Policy rules
Colors in all charts and dashboards, including service and operational dashboards, as well as Amazon Web Services dashboards, now support colorblind accessibility. Random chart colors are theme-specific. We also redesigned the color picker with a new color palette that is different for dark and light UI theme.
-
Azure AD Integration Improvements: Updated the setup and the setup instructions of the Azure AD Integration. You can now easily set up the Azure AD integration yourself without the need to contact our support team, so that users can authenticate to Wavefront through Azure AD instead of using a password.
-
New Metrics to Track RED Metrics: Tracks delta counters, histograms, and points derived as Tracing RED metrics that the collector receives. For details, see Monitor Your Wavefront Service.
- ~collector.delta_points.tracing_red.reported
- ~collector.histograms.tracing_red.reported
- ~collector.points.tracing_red.reported
Note: We have a corresponding direct ingestion metric for each metric. For example, corresponding tocollector.delta_points.tracing_red.reportedwe havecollector.direct-ingestion.delta_points.tracing_red.reported.